• Home
  • Forums
  • Trades
  • News
  • Calendar
  • Market
  • Brokers
  • Login
  • Join
  • User/Email: Password:
  • 1:50am
Menu
  • Forums
  • Trades
  • News
  • Calendar
  • Market
  • Brokers
  • Login
  • Join
  • 1:50am
Sister Sites
  • Metals Mine
  • Energy EXCH
  • Crypto Craft

Options

Bookmark Thread

First Page First Unread Last Page Last Post

Print Thread

Similar Threads

4 Hour Strategy Macd+other Indicator 21 replies

average true range for 1 hour and 4 hour charts 2 replies

X-1102 1 hour , 4 hour and daily Tf trades 7 replies

Create a verticle line at certain hour for every certain hour 16 replies

Is the "4 Hour Strategy (MACD)" the best system here at FF? 20 replies

  • Commercial Content
  • /
  • Reply to Thread
  • Subscribe
  • 12,931
Attachments: 4 Hour Strategy (MACD)
Exit Attachments
Tags: 4 Hour Strategy (MACD)
Cancel

4 Hour Strategy (MACD)

  • Last Post
  •  
  • 1 912913Page 914915916 1579
  • 1 Page 914 1579
  •  
  • Post #18,261
  • Quote
  • Edited 1:25pm Dec 18, 2008 12:05pm | Edited 1:25pm
  •  choontianz2
  • | Joined Sep 2008 | Status: Member | 43 Posts
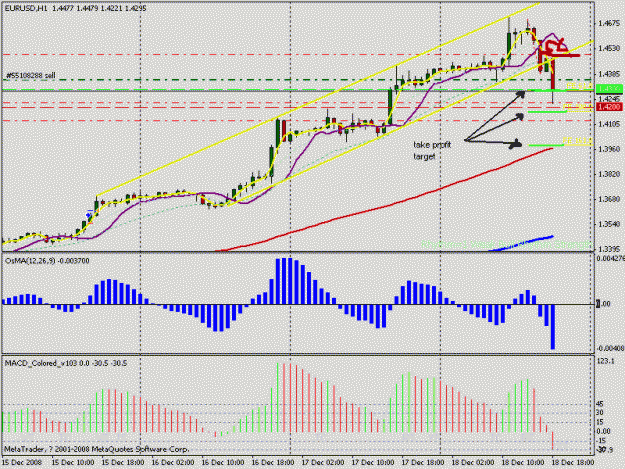
target 1 acheived 34pips...using fibonacci expansion
remaining lot sl will be 1.4383. fibonacci retracement level 61.8. risking 25 pips. abvice me if i get wrong ! i need ur guide. thx
target 2 acheived + 132 pips.
-remaining continue with trailing stop loss 45 pips
-remaining hit the stoploss + 60pips.total 34 + 132 + 60=226 pips.
Attached Image(s) (click to enlarge)
Click to Enlarge

Name: trade 3.gif
Size: 21 KB
Click to Enlarge

Name: trade 3;2.gif
Size: 18 KB
 
 
  • Post #18,262
  • Quote
  • Dec 18, 2008 6:17pm Dec 18, 2008 6:17pm
  •  Palmer
  • | Joined Apr 2005 | Status: Cruising The Outer Rim... | 2,175 Posts
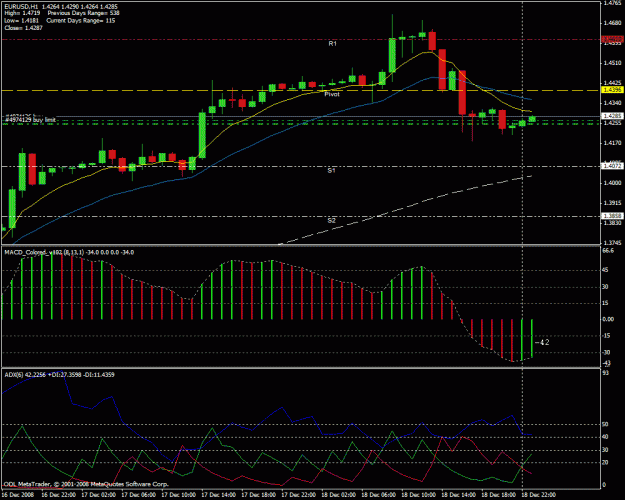
I've been watching this allllll daaaaaay...Trying the 1hr here. First entry at 4269 and some buy limits about 15 pips below that. Almost + 20 right here so I'll keep an eye on things....
Attached Image (click to enlarge)
Click to Enlarge

Name: eu1.gif
Size: 29 KB
 
 
  • Post #18,263
  • Quote
  • Dec 18, 2008 8:14pm Dec 18, 2008 8:14pm
  •  hijackxx
  • | Joined Jun 2007 | Status: PIPz 4 Life | 605 Posts
Quoting mr.krai
Disliked
detail ,
Ignored
those rules are really helping mr.krai
 
 
  • Post #18,264
  • Quote
  • Dec 18, 2008 8:43pm Dec 18, 2008 8:43pm
  •  time1300
  • | Joined Nov 2008 | Status: Keeping Life Simple | 292 Posts
Quoting Palmer
Disliked
I've been watching this allllll daaaaaay...Trying the 1hr here. First entry at 4269 and some buy limits about 15 pips below that. Almost + 20 right here so I'll keep an eye on things....
Ignored
Hey palmer,

quick question, do you have a rule of what is the minimum amount of lots you enter or is it all with how much your money management allows you. For example, it could be 4 once and 2 the other depending how small or big the stop loss?

Also on this particular trade how and where did you place your stop loss, i couldn't find it on the chart

Thanks my friend
Keeping Life Simple
 
 
  • Post #18,265
  • Quote
  • Dec 18, 2008 11:47pm Dec 18, 2008 11:47pm
  •  time1300
  • | Joined Nov 2008 | Status: Keeping Life Simple | 292 Posts
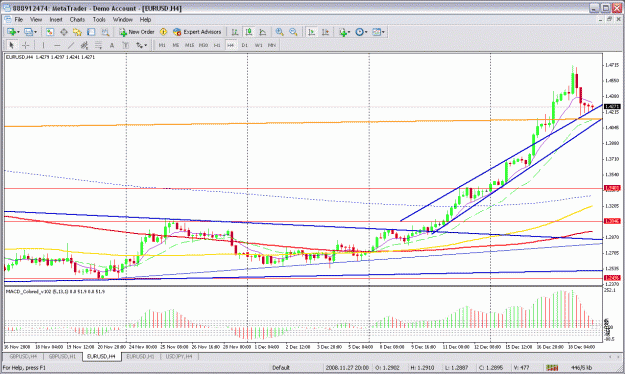
Check out those beautiful tails just on the support line, the trend line when once acted as resistance is not acting as support, a TC might be in the works or Zero Bounce.

Stop loss might be big as it usually is in this market but beautiful tails
Attached Image (click to enlarge)
Click to Enlarge

Name: eurusd 4h.gif
Size: 40 KB
Keeping Life Simple
 
 
  • Post #18,266
  • Quote
  • Edited 3:42am Dec 19, 2008 3:16am | Edited 3:42am
  •  bshadroo
  • | Joined Apr 2007 | Status: Member | 1,126 Posts
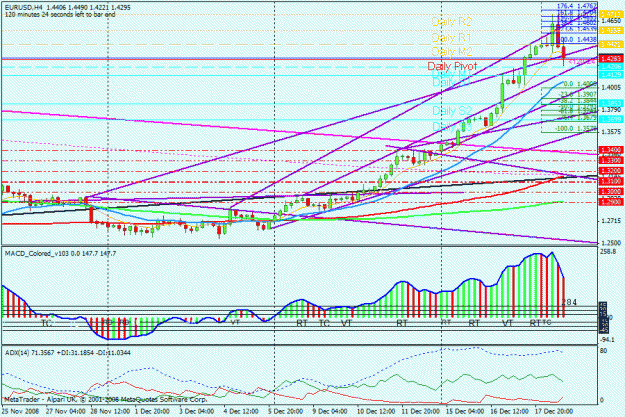
TC in H4 after TL broken and retested ,i have changed my broker and now i can trade with smaller lots for H4 trades
edit:half=30 half=BE
Attached Image (click to enlarge)
Click to Enlarge

Name: 2.gif
Size: 18 KB
 
 
  • Post #18,267
  • Quote
  • Dec 19, 2008 3:53am Dec 19, 2008 3:53am
  •  bshadroo
  • | Joined Apr 2007 | Status: Member | 1,126 Posts
Quoting Palmer
Disliked
I've been watching this allllll daaaaaay...Trying the 1hr here. First entry at 4269 and some buy limits about 15 pips below that. Almost + 20 right here so I'll keep an eye on things....
Ignored
its going to breakdown the red channel,hope u book some profit and get out without loss
Attached Image (click to enlarge)
Click to Enlarge

Name: 1.gif
Size: 23 KB
 
 
  • Post #18,268
  • Quote
  • Dec 19, 2008 4:12am Dec 19, 2008 4:12am
  •  bshadroo
  • | Joined Apr 2007 | Status: Member | 1,126 Posts
Quoting bshadroo
Disliked
its going to breakdown the red channel,hope u book some profit and get out without loss
Ignored
ok ,i sold with microlot after it broke down the red channel ,good thing is this microlot on this market
Attached Image (click to enlarge)
Click to Enlarge

Name: 1.gif
Size: 21 KB
 
 
  • Post #18,269
  • Quote
  • Dec 19, 2008 4:20am Dec 19, 2008 4:20am
  •  saka
  • | Joined Jul 2007 | Status: Macroeconomic trader | 498 Posts
Quoting bshadroo
Disliked
ok ,i sold with microlot after it broke down the red channel ,good thing is this microlot on this market
Ignored
Great trades, Bshadroo, it is quite easy that combine 4h, 1h and 5min strategy together, what you need is just to wait price tests important MAs and find good entry that with low sl and high probabilty to enter. (This is not good for newbie, grasp 4h thythm is first thing)
Plan your trades and trade your plans
 
 
  • Post #18,270
  • Quote
  • Dec 19, 2008 8:17am Dec 19, 2008 8:17am
  •  Palmer
  • | Joined Apr 2005 | Status: Cruising The Outer Rim... | 2,175 Posts
bshadroo/time1300...Nice charts and info!

I took out +25, + 30, and -10 for +45 on that 1hr entry. Price started ranging so I got cold feet and exited when I could, good thing.

Now we have a close below the 21 so this changes things for a little while..
 
 
  • Post #18,271
  • Quote
  • Dec 19, 2008 8:40am Dec 19, 2008 8:40am
  •  kareemoladun
  • | Joined Jun 2008 | Status: Member | 35 Posts
Quoting mr.krai
Disliked
detail ,
Ignored

pls can old trend line acts as resistant ,support for breakout
 
 
  • Post #18,272
  • Quote
  • Dec 19, 2008 8:53am Dec 19, 2008 8:53am
  •  Palmer
  • | Joined Apr 2005 | Status: Cruising The Outer Rim... | 2,175 Posts
Dean:

If you don't mind I re-posted your PM here because I thought it was a very good question(s):

Q1: "I was going through my trades and I came across a calculation question. My question is, when you entry in different stages for example 1.4250, 1.4230 and 1.4210 then do you take the average to calculate your risk to reward ratio or do you take the lowest or the highest entry."

Entry in different stages: I do this quite often, like I did in that previous trade. My long entries were: 4269, 4255(limit), and 4250(limit). Look at the previous several 1hr candles and you will see that they were starting to range a little. I simply decided to put those limit orders somewhere within that range but not too far to the bottom side because of probable weakness on the 4hr: There was finally a close below the 8EMA which hasn't happened for a long time, the 1hr MACD was below zero, and the 1hr mvg avgs were looking weak as well. I was 'hoping' for a double top in the 4hr but this was not the case. It might still happen but I'm already out with +45 so I'll wait for the price to try to come back to the 21. But, per the method, 'if price breaks the 21 and comes back to it, it might continue down to the 89' so we'll see.

Finding entry levels on pullbacks can also be narrowed down to the 30 or 15 minute chart within the previous 1hr or 4hr candle by using trendlines and s/r levels there as well. Just doon't put entry levels (limit orders) so far down that that price area is acutally a turning point in the trend of the 4hr.

Or, you can simply use the previous candle and take that price that is 1/4 below the high, 1/3 below the high or Fib# that candle too.

For the R:R ratio this can be tricky. My initial entry target is always around 20 pips or so and depending on the type of entry. For the SL, if is was a high probability entry and it's just screaming ENTER ENTER ENTER I might use a higher leverage lot size like .5 per. If it is a weak entry (like this one was) I'll use a lower leverage size like .1 and maybe use a larger SL versus a higher leverage lot size to give price more time or room to find it's wheels again. But, I never use a 50, 60, 70...SL just too big. If I can't use a manageable SL on a high leverage entry I won't use it on a smaller leverage entry either because I like to keep things 'standardized'.

So, the risk for me is based on the strength of the market but always within reason.


Q2: "Also in the same trade how do you calculate the Reward aspect of the trade. Do you go by the final profit target that you have assigned. For example lets say there is a major price resistance at 1.4350, then do you use that only to establish your reward ratio. Then if you get out 1/3 of your position, then you just makes notes on it but the only reason you took the trade is because you felt the price has a good probability to go to 1.4350."

Again, the reward aspect is based on the strength of the market and other possible channel, tops/bottoms, trendlines, s/r areas, etc. I usually go in with three seperate lots either all at once or one at once and two limit orders. The first target is always around 20 and the second: if a limit order was used that's about 10 or 15 pips below the first entry, that means that I'll have 30 or 35 pips from that entry that is back to the original TP area of the first entry, even more if the second limt was a little below that. So, that being the case this is close to 100 pips for those three entries just to the original TP area of the first entry. 100 pips is 100 pips! If I go in all three at once (which is usually a very strong market) then the first is always 20 again and then other two lots are looking for those areas that might be 30, 40, 50+ pips away to the next historical price high/low or channel top/bottom. If the market is running hard and gives only a few opportunities to get in this is where those 'happy pip' trades can happen. Of course you have to be awake too.

So, for me TP areas really depend on the strength of the market. I'm real conservative about TP is weak markets (that's why I exited that previous trade when price was stagnant on the 1hr and weak) but I won't chase things in a strong market either because if I have a chance to get in all three lots at once I'm thinking price will continue. Again, the rhythm must be strong here.


Q3: "so how do you calculate your initial risk to reward before the trade even while when you are in the trade you might enter and exit in different stages."

It's all within reasonable limits per that entry. But agian, don't put a limit order in where it might be a weak area on the 4hr such as if price is nearing the 21 and the 4hr has about 30 minutes to close, I wouldn't out an order in 20 or so pips below the 21 becasue it could end up closing below it and price action decides to keep going down.

thank you

dean


Hope some of this helps....
 
 
  • Post #18,273
  • Quote
  • Edited 9:09am Dec 19, 2008 9:04am | Edited 9:09am
  •  kareemoladun
  • | Joined Jun 2008 | Status: Member | 35 Posts
Quoting Palmer
Disliked
bshadroo/time1300...Nice charts and info!

I took out +25, + 30, and -10 for +45 on that 1hr entry. Price started ranging so I got cold feet and exited when I could, good thing.

Now we have a close below the 21 so this changes things for a little while..
Ignored

there is one indicator that can tell you the direction of breakout for a day
the indicator is pivot point when price open above daily pivot; it means we should be expecting breakout in upward
but when price open below daily pivot; it means we should be expecting brreakout downward .it can help to ease which direction would be the breakout
but i do not know how to attach the indicator from my custom indicator
see chat below
Attached Image(s) (click to enlarge)
Click to Enlarge

Name: trending.gif
Size: 31 KB
Click to Enlarge

Name: trending2.gif
Size: 31 KB
 
 
  • Post #18,274
  • Quote
  • Dec 19, 2008 11:56am Dec 19, 2008 11:56am
  •  mr.krai
  • | Membership Revoked | Joined Aug 2008 | 71 Posts
Quoting kareemoladun
Disliked
there is one indicator that can tell you the direction of breakout for a day
the indicator is pivot point when price open above daily pivot; it means we should be expecting breakout in upward
but when price open below daily pivot; it means we should be expecting brreakout downward .it can help to ease which direction would be the breakout
but i do not know how to attach the indicator from my custom indicator
see chat below
Ignored
example breakout candle close below sma89 and candle pullback trendline
Attached Image (click to enlarge)
Click to Enlarge

Name: gutoday.gif
Size: 79 KB
Attached File(s)
File Type: pdf breakout pilip.pdf   161 KB | 2,278 downloads
{Promotion Removed}
 
 
  • Post #18,275
  • Quote
  • Dec 19, 2008 1:34pm Dec 19, 2008 1:34pm
  •  baco75
  • | Joined Oct 2008 | Status: Member | 61 Posts
Hello guys,

I have never seen such a fast move on the euro up and then down. What do you think will happen? Has the trend reversed now and going back down? Is it going to retest the 21 or going straight down to the 89 again?
I am really puzzled...
Thank you for any ideas!
 
 
  • Post #18,276
  • Quote
  • Dec 21, 2008 1:59pm Dec 21, 2008 1:59pm
  •  Phillip Nel
  • | Commercial Member | Joined Nov 2006 | 2,223 Posts
Hi
Just to say that I am done trading for the year. I have closed my stocks portfolio for the year on Friday ending 26,98% higher for the year. I will be back active the first week of January2009. I will still be available on the e-mails or private message if you want to chat or want to know or discuss something.
Thanks for the support and the good spirit from you all. May you expereince a good Christmas and a very prosperous and happy new year.

Phillip and family
 
 
  • Post #18,277
  • Quote
  • Dec 21, 2008 3:33pm Dec 21, 2008 3:33pm
  •  hugozavala87
  • | Joined Nov 2007 | Status: Member | 9 Posts
Merry Christmas for you all... Does anyone know an e.book for price action ?
 
 
  • Post #18,278
  • Quote
  • Dec 21, 2008 5:27pm Dec 21, 2008 5:27pm
  •  Palmer
  • | Joined Apr 2005 | Status: Cruising The Outer Rim... | 2,175 Posts
Hey Phillip. Good stuff on the stocks, I did just over 37% writing covered calls starting this past July. I'm sure you blew us all away in the FX markets though. Hope the email addresses continue

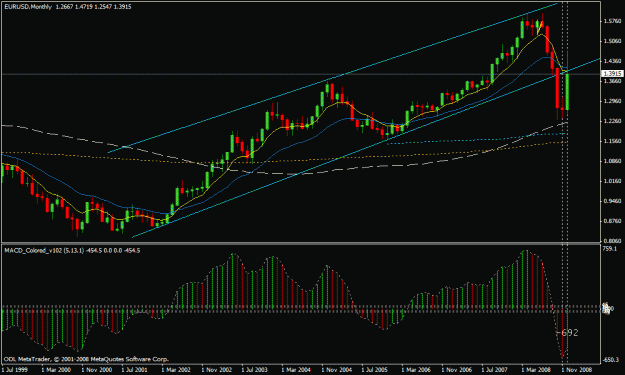
I was looking at the EURUSD and had to go back to a monthly/weekly chart for a long term uptrend line that actually showed a real bottom at some point and see something interesting. You can see that at the break of the trendline price has now come back to it. And what is the old rule that we have heard/read many times..."Previous support once broken can become resitance..." What does this mean to us 'here'? This is a long term thing here but it might point to a change in the trend on the 4hr. With the break of the 21 we have weakness first of all. Now, the market can do whatever it wants to regardless of which indicator you have on your chart but this is just my humble 2 pips here of what I'm thinking with the 4hr EURUSD. With the oil market tanking 'something' might happen that will cause the dollar to strengthen to boost oil prices. I think the demand will still be low because the US economy is not going to rebound any time soon. But, I see the general shape of the 4hr possibly making it's way back down to at least the 3300 area, some 600 pips south. I have no idea about when this might 'start' or how long it might take to get there but it's just how I see things setting up per the charts. Also, a double top wouldn't surprise me at all given how volatile things have become but I'm thinking a downturn, a substantial one at that. Hmmm, what do they really call trading the markets...oh yeah...speculation. So don't quote me here
Attached Image(s) (click to enlarge)
Click to Enlarge

Name: eum.gif
Size: 23 KB
Click to Enlarge

Name: euw.gif
Size: 23 KB
Click to Enlarge

Name: eu4.gif
Size: 16 KB
 
 
  • Post #18,279
  • Quote
  • Dec 21, 2008 10:57pm Dec 21, 2008 10:57pm
  •  time1300
  • | Joined Nov 2008 | Status: Keeping Life Simple | 292 Posts
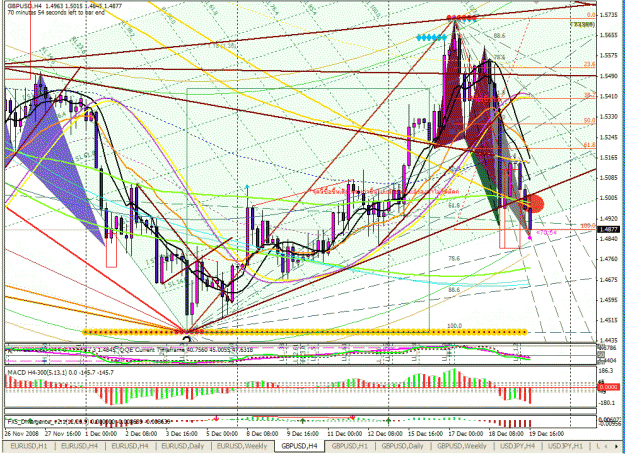
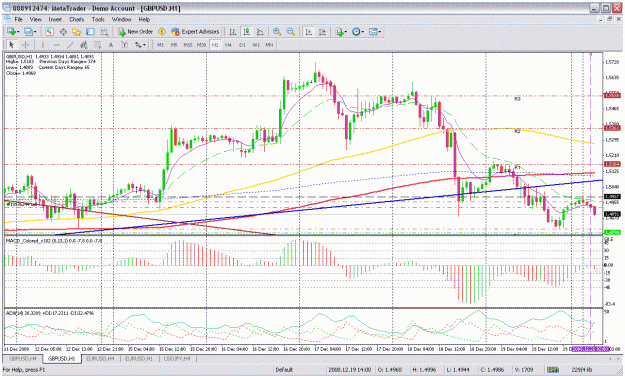
Gbp/Usd Trade

Price recently crossed below 89sma
Price then retraced back up to the 89sma and bounced off of the 89sma with a bearish engulfing candle
On the 1H close of 01:00 candle, zero bounce MACD signal
On the 1H price movement, price bounced off the 21ema
1H ADX indicator, -DI line crossing over +DI Line (illustrated on the gbpusd 1H ADX chart with dotted purple line)

Entered 0.3 lots @ 1.4931
S/L @ 1.4995 (above the 4H candle) -64 pips
1st TP +25 pips
2nd TP @ 1.4810 (just above daily S1)

Edit:
Closed 0.1 (+29 pips)
Remainder moved to BE -29 pips

P.S. Hello palmer, I have the same trend line on my chart and I would have to agree with you, I also see a downward bias. On Eur/Usd 4H, price has retraced back to the 21ema with big tail confirmation. Switching to the 1H, there is a zero break in the making. I will be looking carefully.
Attached Image (click to enlarge)
Click to Enlarge

Name: gbpusd 1h adx.gif
Size: 49 KB
Keeping Life Simple
 
 
  • Post #18,280
  • Quote
  • Dec 22, 2008 8:13am Dec 22, 2008 8:13am
  •  Palmer
  • | Joined Apr 2005 | Status: Cruising The Outer Rim... | 2,175 Posts
I agree. The EU 'looks' like it wants to go south right now but the news calendar looks a little thin right now to get anything moving but anything can happen in FX.....
 
 
  • Commercial Content
  • /
  • 4 Hour Strategy (MACD)
  • Reply to Thread
    • 1 912913Page 914915916 1579
    • 1 Page 914 1579
1 trader viewing now
  • More
Top of Page
  • Facebook
  • Twitter
About FF
  • Mission
  • Products
  • User Guide
  • Media Kit
  • Blog
  • Contact
FF Products
  • Forums
  • Trades
  • Calendar
  • News
  • Market
  • Brokers
  • Trade Explorer
FF Website
  • Homepage
  • Search
  • Members
  • Report a Bug
Follow FF
  • Facebook
  • Twitter

FF Sister Sites:

  • Metals Mine
  • Energy EXCH
  • Crypto Craft

Forex Factory® is a brand of Fair Economy, Inc.

Terms of Service / ©2023