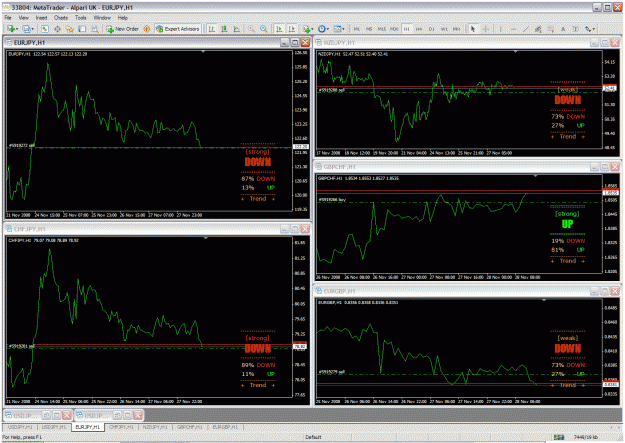
You've already open 6 chart, now this what you have to do:
- Apply EMA 24 price High & low
- Apply EMA 120 price High & Low
- Apply EMA 480 price High & Low
So you will have 6 EMA on your chart. Just use different color to make you easy read them.
What is it for ?
EMA 24 H&L will tell you the border for 24 hours trend. (Daily Trend)
EMA 120 H&L will tell you the border for 120 hours trend. (Weekly trend)
EMA 480 H&L will tell you the border for 480 hours trend. (Monthly trend)
Just apply...
Ignored
Cheers KG. You are a star.
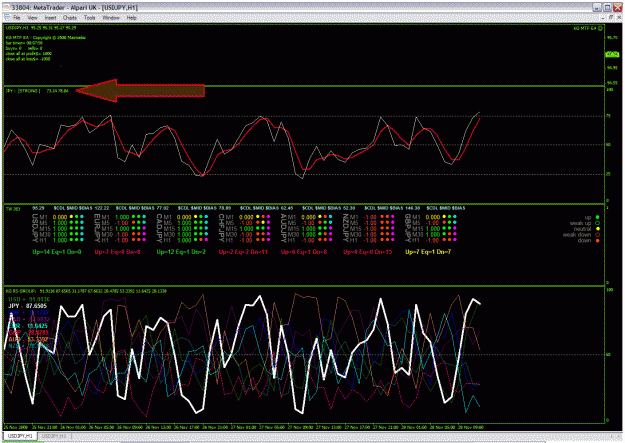
What this seems to be highlighting is the gathering strength of jpy for a couple of months. Pulling in closer and looking at the last couple of days, I see a lot of markets ranging with the price movement being squeezed, suggesting a breakout is likely soon.
The longer-term trends suggest to me that I can leave a seemingly unsuccessful trade basket in place for longer if the basket is trading in the direction of the trend. When to close an unsuccessful basket is one of the things exercising my mind at the mo.
What this seems to be highlighting is the gathering strength of jpy for a couple of months. Pulling in closer and looking at the last couple of days, I see a lot of markets ranging with the price movement being squeezed, suggesting a breakout is likely soon.
The longer-term trends suggest to me that I can leave a seemingly unsuccessful trade basket in place for longer if the basket is trading in the direction of the trend. When to close an unsuccessful basket is one of the things exercising my mind at the mo....
Ignored
Correct... that's what i'm doing so far..
Explore it... you will get the feeling how to play "basket trading" for long term.
Correct... that's what i'm doing so far..
Explore it... you will get the feeling how to play "basket trading" for long term.
Regards,
KG
Ignored
Instead of the single trade I had in place to keep the separate 6 chart account open, I have taken out a basket of sells that I shall leave in place. It will be interesting to explore what happens to it.
|
Joined Oct 2008
|
Status: Basket Case or Basket Trader?
|798 Posts
Not sure if this has been "noticed" before but there is a really simple indication shown on the chart....... (that may or may not be useful to you)
Next to the [STRONG] [WEAK] alert are the numbers used.
Looking back over the last 10 days of trade if you only accept the [STRONG] [WEAK] signal if the difference between the 2 numbers is at least 10 then you are SEVEN times more likely to bag a winner!
68.23 - 74.81 = NO
68.23 - 79.11 = YES
51.74 - 67.22 = YES
51.74 - 54.67 = NO
I wouldn't trade just on this but use it as another layer or filter with everything else.
Not sure if this has been "noticed" before but there is a really simple indication shown on the chart....... (that may or may not be useful to you)
Next to the [STRONG] [WEAK] alert are the numbers used.
Looking back over the last 10 days of trade if you only accept the [STRONG] [WEAK] signal if the difference between the 2 numbers is at least 10 then you are SEVEN times more likely to bag a winner!
68.23 - 74.81 = NO
68.23 - 79.11 = YES
51.74 - 67.22 = YES
51.74 - 54.67 = NO
I wouldn't trade just on this but use it as another...
Ignored
That is a clever piece of observation, Eddie (whether it is or not, I have to call it 'clever' cos I had not noticed ). Thanks.
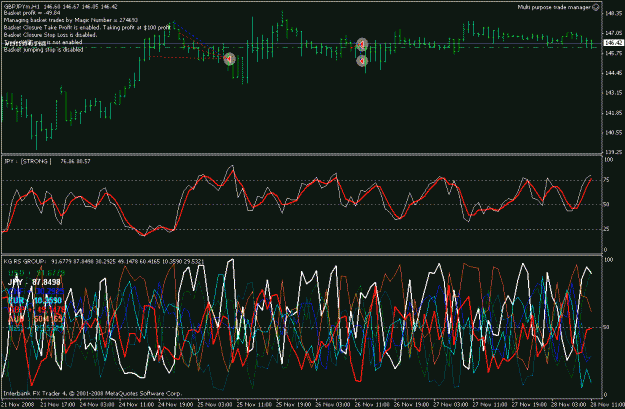
Here is one from me - pretty obvious but I am wondering if it has any significance. JPY tends to traverse the whole depthheight of KG RS GROUP. At either extremes, it appears to be so overboughtsold that a reversal is inevitable.
Those reversals that send JPY upwards in the direction of its longer-term trend tend to go right to the top. Those reversals that send it down against its longer-term trend tend to fizzle out roughly three quarters of the way down.
The pic shows JPY at a top, so a reverse is likely. As an experiment, I have taken out a weak basket much earlier than the indis would show. We shall see.
i'd like to ask about indicator that was made by ferrufx which is ccfp-diff v2..
does anyone still use that?
if you do, please share the consistency..
thanks
Ignored
Here it is. I use it - it is fabulous. 4h chart, Trade_Level 2 give fantastic signals every 4 hours. I set my management ea to close trades after 210 minutes, using that as my stop loss.
Here it is. I use it - it is fabulous. 4h chart, Trade_Level 2 give fantastic signals every 4 hours. I set my management ea to close trades after 210 minutes, using that as my stop loss.
Here it is. I use it - it is fabulous. 4h chart, Trade_Level 2 give fantastic signals every 4 hours. I set my management ea to close trades after 210 minutes, using that as my stop loss.
Ignored
wow.. it gives more confident...
may i know your winning ratio? how far is the consistency?
does it exceed 80%?
to KG
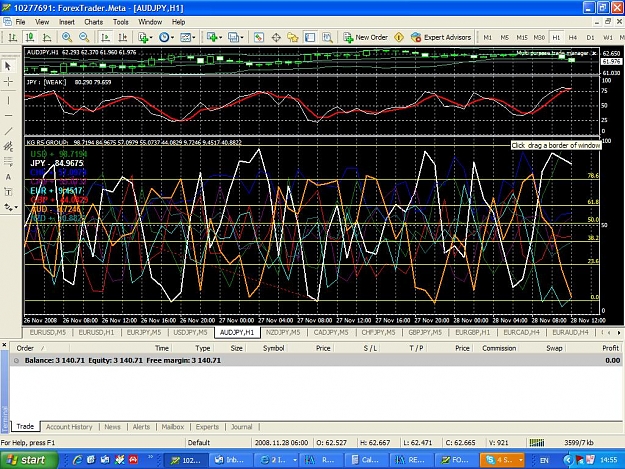
Please explain. Like you see on chart, KG RS group show me JPY strong and goes to weak this moment. RS Group JPY show WEAK. So if RS GROUP will reverse to STRONG this moment, I must sell EUR/JPY,USD/JPY .... , because KG RS group show strongest JPY and RS Group JPY is STRONG. Corect?
to KG
Please explain. Like you see on chart, KG RS group show me JPY strong and goes to weak this moment. RS Group JPY show WEAK. So if RS GROUP will reverse to STRONG this moment, I must sell EUR/JPY,USD/JPY .... , because KG RS group show strongest JPY and RS Group JPY is STRONG. Corect?
Ignored
Have a look at post #1046 (above). Because the STRONG / WEAK can change so quickly you may want to consider using this extra filter to prevent you walking directly into a reverse.
As you will see from your image the difference between the numbers on your chart is less than 1 (80.290 - 79.659)
Hi Eddie, the MTF EA's are mine, is there a problem?
Ignored
No No!
I had an issue where after opening a few trades it just decided to not open any more. I know this may be in line with the market conditions so I just ignored it... then I started to notice that as I manually closed down all trades within a few minutes it would open again.
I was reading Steves post and wondered if the same problem was happening with the opening more than on set of trades due to the same magic number.... but it seems to be fixed now.
Strange.......
I am running the EA at the moment....... it is getting more right than wrong.
It would be nice to have a restriction on how many open trades it can have at any one time... it managed 14 opens in a few seconds which scared the crap out of me.....
So any updates, tweaks you have would be welcome (please)