|
Joined Oct 2008
|
Status: Malaysia Boleh!
|89 Posts
This month all i do, morning go to work, then read Fx Forum, work, read, work, read. And i finally i decide, i MUST know this amazing knowledge... FIBONACCI.
I learn trough online and pay my GURU, but after the payment he kept silence, and that really worry me.
Thank you Mr Bobokus, because in this hattic world still there are people like you, sharing your knowledge with others.
May god bless you... keep up this good work. I ll alway reading your writting... Bekenu people salute you.
---my broken English, sorry---
Ignored
I can understand what you mean, there are alot of guru's out there that dont really know what they are doing. I dont think any of my students have ever been disappointed.
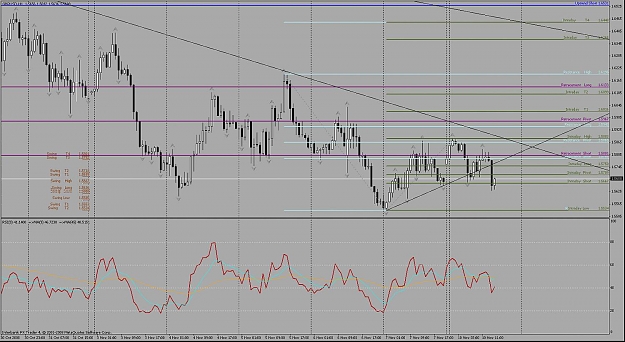
GBP looks to fall below it opening price for the week so we may see weakness in it the rest of the day, Euro is teeter todering at its opening price for the week as well, If we get closes today back below the openings for the week we will look for weakness to continue into the following day.
With the Euro now that weve had some movement, were looking for it to make a low so we can establish the resistance points, to keep the selling pressure on. If the selling pressure is to continue we can expect it to occur at these points. Ive switched this 4 hour chart to a 1 hour just to get a quick perspective. If this is not the low we continue to pull the low of the resistance tool to give us our resistance points to price once it does establish a low. Continue pulling the low of this until it retraces.
|
Joined Dec 2007
|
Status: Cash Rules Everything Around Me
|749 Posts
I just took a GBP short. I see a small H&S pattern below our retracement fibs, and price has been respecting resistance fib, also price just closed below intraday short, and we also have a break of the upper TL price had been respecting. I'm targeting the lows at 5534. Wish me luck. Entries @ 5660, 5672, 5692.
With the Euro now that weve had some movement, were looking for it to make a low so we can establish the resistance points, to keep the selling pressure on. If the selling pressure is to continue we can expect it to occur at these points. Ive switched this 4 hour chart to a 1 hour just to get a quick perspective. If this is not the low we continue to pull the low of the resistance tool to give us our resistance points to price once it does establish a low. Continue pulling the low of this until it retraces.
Ignored
in that chart my intraday is at : 1.2898 &1.2652 , it is fine ?
in that chart my intraday is at : 1.2898 &1.2652 , it is fine ?
Ignored
Those examples were based on the 4 hour timeframe. Your Intraday on the 1 hour would have been on the high and low of friday, but now the target range of that has been met and were seeing the retracement from that now. The next Intraday isnt set yet since we have alot of time left before we know that a high and low of today have been established. Support levels would have to come from the 4 hour since weve had a 2 day movement or push up in price.
I just took a GBP short. I see a small H&S pattern below our retracement fibs, and price has been respecting resistance fib, also price just closed below intraday short, and we also have a break of the upper TL price had been respecting. I'm targeting the lows at 5534. Wish me luck. Entries @ 5660, 5672, 5692.
Ignored
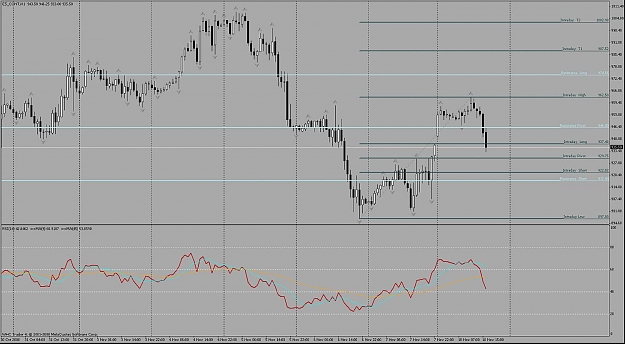
The move down was quick and deep so there may be some retracement before it can continue down, just be wary. If its met its low for the day advance your Intraday to todays movement to give yourself the resitance levels to this movement.
The move down was quick and deep so there may be some retracement before it can continue down, just be wary. If its met its low for the day advance your Intraday to todays movement to give yourself the resitance levels to this movement.
Ignored
Thanks Bo. I'm also keeping an eye on the S&P right now. It seems like the 2 move pretty similarly right now. It has a few more points to retrace to before it meets it's .50 retracement.
Have you noticed any similarities between the indices and cable? I think S&P works pretty well, but I'm curious if you've seen that maybe DJIA or Nasdaq tracked more closely.
Ignored
For now they may correlate but it wont last, they dont have a history of tracking with each other.Look more at the Dollar index for a view of dollar strength against the other majors, theres more of an inverse correlation there.
Thanks Bo. I'm also keeping an eye on the S&P right now. It seems like the 2 move pretty similarly right now. It has a few more points to retrace to before it meets it's .50 retracement.
Have you noticed any similarities between the indices and cable? I think S&P works pretty well, but I'm curious if you've seen that maybe DJIA or Nasdaq tracked more closely.
Ignored
Try this change your RSI from 14 to 50, its tracking with price set that low and not really helping since its movments are tracking so closely.Then look to buy rally's in price when its above 50 and selling rally's when it below 50. It will remove some of the whip and show you a view closer to matching price to a 50MA and show the trending movements better.
Put a 14 ma on your chart and look at the points the RSI move above and below the 50 level, it should be closely matching the points price breaks a 14 ma on the chart. Thats what the rsi is showing you at that setting.Basically trading from a 14MA
For now they may correlate but it wont last, they dont have a history of tracking with each other.Look more at the Dollar index for a view of dollar strength against the other majors, theres more of an inverse correlation there.
Ignored
Maybe it was pure luck, but I closed my cable trade about 10 minutes before the 1 hr close because I saw a 5 minute pin bar on S&P, which isn't the PA I wanted to see as it's close to the .50 level. Cable shot up immediately after.
I use dollar index too and I definitely find value in it. I guess as traders we just need to be aware of everything around us and try to use it to our advantage.
Will keep monitoring the PA on cable though. Perhaps the backside of the TL may be a nice spot to see what happens there.
Ignored
Looks as if resistance will hold on this retracement. Price made a quick run up to test it.
Try this change your RSI from 14 to 50, its tracking with price set that low and not really helping since its movments are tracking so closely.Then look to buy rally's in price when its above 50 and selling rally's when it below 50. It will remove some of the whip and show you a view closer to matching price to a 50MA and show the trending movements better.
Put a 14 ma on your chart and look at the points the RSI move above and below the 50 level, it should be closely matching the points price breaks a 14 ma on the chart. Thats what the rsi is showing you at that setting.Basically trading from a 14MA
Ignored
I use the RSI more to find patterns in it and look for buy/sell signals. But I don't use it to detect oversold/overbought b/c it can't tell you that (don't use it that much for regular divergences either). On my 1 hr chart it's showing me a small buy signal, that will only be invalidated with price trading below 5592. I kind of use RSI the way John Hayden uses it, but definitely not the way Welles Wilder intended. The 50 setting will be too slow for my application, but setting it that high will show me something different so I'll definitely give it a shot. Thanks for the idea...see if I can put it to use.
I use the RSI more to find patterns in it and look for buy/sell signals. But I don't use it to detect oversold/overbought b/c it can't tell you that (don't use it that much for regular divergences either). On my 1 hr chart it's showing me a small buy signal, that will only be invalidated with price trading below 5592. I kind of use RSI the way John Hayden uses it, but definitely not the way Welles Wilder intended. The 50 setting will be too slow for my application, but setting it that high will show me something different so I'll definitely give it a shot. Thanks for the idea...see if I can put it to use.
Ignored
Just wanted to make sure you were not entering from it.
|
Joined Dec 2007
|
Status: Cash Rules Everything Around Me
|749 Posts
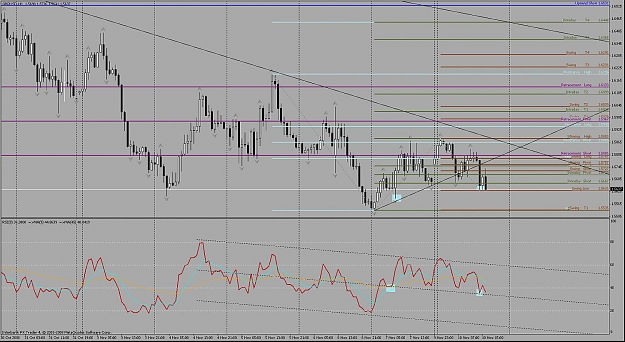
Right now the RSI is trading in the downtrend channel. If it remains in this channel it will remain bearish, so that is the preference for now. RSI will need to be above 60 and above this channel for me to think that it's bullish. The 2 boxes on the PA and RSI show the small buy signal. I'm not favoring the bull scenario though as the PA seems bearish. So if anything I'm looking for a re-entry with RSI towards the top of this channel @ 60 level, but I think I'm done trading now. LOL. It took me time to get used to trading with it, but I can't trade without it now.
Right now the RSI is trading in the downtrend channel. If it remains in this channel it will remain bearish, so that is the preference for now. RSI will need to be above 60 and above this channel for me to think that it's bullish. The 2 boxes on the PA and RSI show the small buy signal. I'm not favoring the bull scenario though as the PA seems bearish. So if anything I'm looking for a re-entry with RSI towards the top of this channel @ 60 level, but I think I'm done trading now. LOL. It took me time to get used to trading with it, but I can't trade without it now.
Ignored
Bud cool stuff...But I see that its what price is showing us....if we simply put a linnear regression channle like Bo tought us we still have the channel as well as see the direction of the market...I might be wrong since I am not experienced with that indicator to its full potential...