DislikedPhillip:
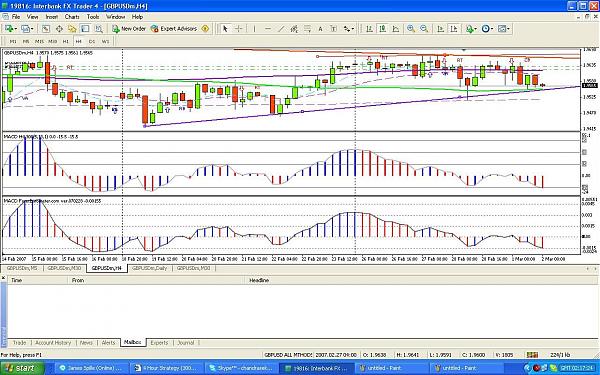
Just went through the MP3 file, thank you again. Sometimes you just have to let go of chains. Nice work on the doji's (shooting stars) on the EURUSD, especially when there is more than one next two each other. Either way: to everyone: it's a lot of work keeping up with a system or method that you have posted on a forum. It takes a lot of time and effort to keep things going and answer everything. Phillip has given us a great method to look at and STUDY. This is a very straightforward system to get through. I noticed a few things last night that I may have totally forgotten. Here is the 4hr EURUSD. The yellow dashed lined are drawn through the rounded MACD bottoms. Notice what the three shorter MA's are doing...There are at a confluence along with the RB's, they are close two each other along with the MACD formation. Yes, it is the price action that forms the RBs but notice the price action when the signal is given (green) on the MACD. Got it? Good. Now, the gray dashed lines: after the price action touches the 21 and bounces up, again look at the MACD signal (green), and the price action that follows. Easy pickens. Where to put the SL? Maybe a few pips below the candle before, no more or less. Study the previous charts. It's all there, if you can see the answers, that's even better.Ignored
Nice post!
(I like the zenlike part about seeing the answers best! (or based on your tagline, Yodalike..hehe)