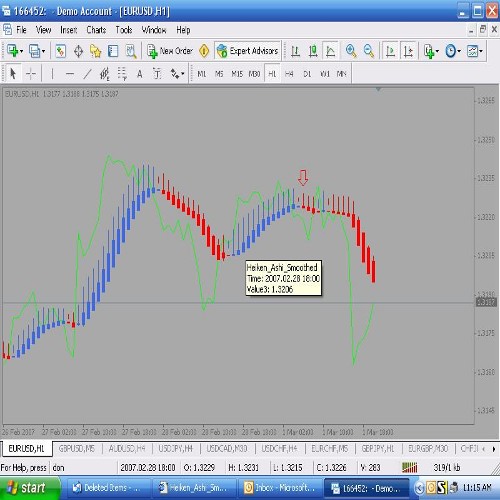
Attached is the image from last night when I posted this prediction. No big deal just a winning trade. There was a moment that the trade had a pause indicated by the blue bar and no other longer TF to indicate staying in. But if you study the system long enough even these tough calls will be handled easier with practice. Notice the short candle body and wick:body ratio in favor of wick. This is not a strong indication of a trend reversal.
[/quote]
[/quote]
Attached Image