First, thanks so much for this post - I definitely would love to implement it in my trading!
I am new to this forum so I am not sure how Tradestation users are viewed
I am a developer so I have no problems coding this indicator in TS 8,2 (and can share it once I'm done), but I was hoping someone could give me the formula breakdown - completely new to this indicator.
I have looked at the ones on the TS forums but the don't quite look the same as yours, and based on what I see, I would much prefer to do it exactly as you have it.
Again, to start with, I just need the formula details - then I can review these posts and study to determine how to best read the indicator.
Many thanks in advance!!!
Cheers.
Ignored
Hi Stepwise
I agree. The TTM trend is not Heiken Ashi, and the Heiken Ashi on TSW are different to this one, as there is an up, down and a warning colour.
The HMA's on TSW or also different to the ones discussed here, i think.
I have been setting this up and trying to test the smoothed HA out, but I just had a few questions.
First of all, lets use the 15m, 30, 1h timeframes. So you start to see blue candles on the 15m chart and wait for the 30m chart to start forming its 1st blue candle. Wait for the candle to finish forming in the 30m TF and then enter as the price moves upwards from the HA candle. All this is done before the 1h candle has started to become blue. So now you are in and the 15m candles are starting to go red, so you wait till the 30m candles start to go red, and exit BEFORE the 1 hr candles become red because that way you will still have profit. Now that you have exited, HAS A PERFECT SHORT opportunity arisen? and do you enter a short position immediatley?...I say this because for you to have exited form your long position, you will have had all the same confirmations as you would have had if you were not in any position and waiting for the sell??
My second question, is how do you get those bands on the charts that touch all the wicks of the HA smoothed candles?
Any help on either of these points would be greatly appreciated.
Yes you have the set-up correct. I feel there are many approaches that will work with this indicator but the one that I described is just something I am working with. The answer is yes. You can make this trade a SAR (stop and reverse). Just as long as there are confirming signals on the three time frames.
I just want to throw out some other thought here. Lets say you look at a 15M TF and it starts to go blue. So you look at the 30M and it just paints its first blue candle. So you go long. You might ask why did I even look at the 15M TF and just look at the 30M for the start of a beginning blue candle?
Well the reason is since this is a lagging indicator you can really get in early on the FIRST blue candle on the 30M. It's like a running start which might yield some extra PIPS.
Now let's say you want more risk and want more early PIPS. Well you can enter on any TF say the 15M and start trading aslong as the 30M PRICE itself is pointing up (long position). The reason is if you are correct the 30M will eventually change color and you were in prematurely in the anticipation of that first color change. If it doesn't change you entered too early and you must exit when the SHORTER TF fails.
Today I will look to see if this indicator REPAINTS. If it does I will be disappointed and need to look at the ramifications of my back testing. If it does repaint I believe it will still serve a purpose for good trading but I will need more time with it.
I have been setting this up and trying to test the smoothed HA out, but I just had a few questions.
First of all, lets use the 15m, 30, 1h timeframes. So you start to see blue candles on the 15m chart and wait for the 30m chart to start forming its 1st blue candle. Wait for the candle to finish forming in the 30m TF and then enter as the price moves upwards from the HA candle. All this is done before the 1h candle has started to become blue. So now you are in and the 15m candles are starting to go red, so you wait till the 30m candles start to go red, and exit BEFORE the 1 hr candles become red because that way you will still have profit. Now that you have exited, HAS A PERFECT SHORT opportunity arisen? and do you enter a short position immediatley?...I say this because for you to have exited form your long position, you will have had all the same confirmations as you would have had if you were not in any position and waiting for the sell??
My second question, is how do you get those bands on the charts that touch all the wicks of the HA smoothed candles?
Any help on either of these points would be greatly appreciated.
thanks for the reply steniz...some interesting points raised there.
Just talkingmore about the stop and reverses, if you got confirmations, then technically, you would never be out of the market, you would either be short or long. .... i mean this is if you had enough time to be at your computer all day and just keep reversing the trades when you got more confirmation signals.
One quick question about that though, when the market is going sideways, there may be times when the 15m candles start to turn blue and signal a long entry, so you look at the 30m which turn blue as well then you enter, but after 2 or 3 blue 30m candles, they start to go red again, so you would you exit at a loss or look at the 1h TF? there are lots of times from the charts where you only get 2 or 3 blue 30m candles and then 2 0r 3 red candles, and they chop and change colour a few times before you get any real trend going. So I think what I'm saying is how do you filter out these "noises" in the market?
I have been using this system since last year trading live [only demo'ed for less than a month], and it has worked for me. Its my primary trading system for trending and ranging markets.... I know there are many skeptics, but what works for one may not work for another - just like many other systems posted here and elsewhere.
Ignored
Hi. Can you tell me how you use it in ranging markets please (tranding is obvious).
1. Obviously a bigger candle body a bigger move but what does the upper wick tell us about the trend strength? 2. Why are there so many upper wicks compared to almost non-existent lower ones?
Ignored
Hi Steinitz,
I am new to this indicator and with the lack of formula information, I am learning by coding to match your images (don't have MetaTrader just TS).
So, it looks like your two questions are very much related.
I can answer question #2.
Body = range between Open and Close
Wick = range between High and Low
From what I can tell (again, based on my own programming and no access to the actual formula used), the wicks are on top to give a clearer picture of the actual differences between body and wick. I achieved this same look in TS by determining the range of the Open and Close and showing that as the body from the low of the bar.
I personally like this as it is a consistent / smooth view of what is happening.
I believe you answered question #1 in previous posts.
The larger the wick and the shorter / smaller the body the closer we are to a turn (change in trend)?
I have programmed this using a basic smoothed average but I know it is not the actual smoothing function used.
One start to this might be an explanation of what the parameters 2-6-3-2 pertain to.
Any insight into this would be greatly appreciated.
Thanks Chazbo- I had not considered that. One of my favorite charts combines a simple stochastic and the Hull Moving Avg. With the sms alerts, it makes it extra special. I keep a chart active for all pairs.
Ignored
Hey JokersWild,
Could you tell me what length you used for this HMA?
I am extremely happy to report that this indicator does not repaint. I was looking back on charts this weekend using the 4H on various currencies. I would SAR the trade and always be in it. I was racking up some rediculous high profits and thought to myself this indictaor must be repainting itself lending to false historical data.
Upon looking at some key reversal points I noticed that I was staying in at some rare times just before a huge reversal and thought this couldn't be right that next bar would have averaged in and shown a SAR candle. So I was feeling kinda sh-ty and thought here we go again another repainting indicator!
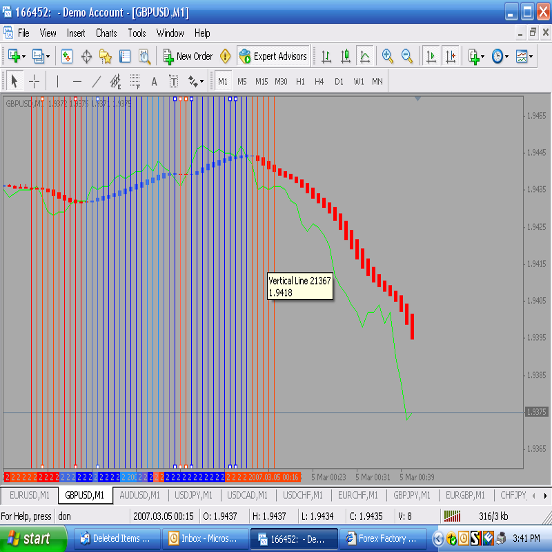
So this afternoon I looked at 10 currencies on the 1M TF and drew red and blue lines LIVE to see if any repainting was going on. NONE !
That means I am doing the humpty dance of joy my friends. I have attached just 5 of my charts. No repainting on 1M is just as telling as 30M or any other TF.
I don't have programming experience but I can tell you if you Google this indictor you will get some extra information out there. I would say the majority is on this indicator without smoothing. I have been looking ta all different types of like indicators and I came up with:
1. HMA
2. HMA Modified
3. HMA 2 color
4.HMA_Russian_color
People are out there looking at this as the basis for other developments. I just glanced over at Cable. Look atwhat just continued!!!!!
I am new to this indicator and with the lack of formula information, I am learning by coding to match your images (don't have MetaTrader just TS).
So, it looks like your two questions are very much related.
I can answer question #2.
Body = range between Open and Close
Wick = range between High and Low
From what I can tell (again, based on my own programming and no access to the actual formula used), the wicks are on top to give a clearer picture of the actual differences between body and wick. I achieved this same look in TS by determining the range of the Open and Close and showing that as the body from the low of the bar.
I personally like this as it is a consistent / smooth view of what is happening.
I believe you answered question #1 in previous posts.
The larger the wick and the shorter / smaller the body the closer we are to a turn (change in trend)?
I have programmed this using a basic smoothed average but I know it is not the actual smoothing function used.
One start to this might be an explanation of what the parameters 2-6-3-2 pertain to.
Any insight into this would be greatly appreciated.
The noise that can't be filted = loss. Accept it! Nothing is perfect. This is about as good as it gets. I have never seen anthing that touches the preciseness, lack of shaking you out of a trade, and the ability to stay in a trade 24 hours a day implimenting SAR approach.
thanks for the reply steniz...some interesting points raised there.
Just talkingmore about the stop and reverses, if you got confirmations, then technically, you would never be out of the market, you would either be short or long. .... i mean this is if you had enough time to be at your computer all day and just keep reversing the trades when you got more confirmation signals.
One quick question about that though, when the market is going sideways, there may be times when the 15m candles start to turn blue and signal a long entry, so you look at the 30m which turn blue as well then you enter, but after 2 or 3 blue 30m candles, they start to go red again, so you would you exit at a loss or look at the 1h TF? there are lots of times from the charts where you only get 2 or 3 blue 30m candles and then 2 0r 3 red candles, and they chop and change colour a few times before you get any real trend going. So I think what I'm saying is how do you filter out these "noises" in the market?
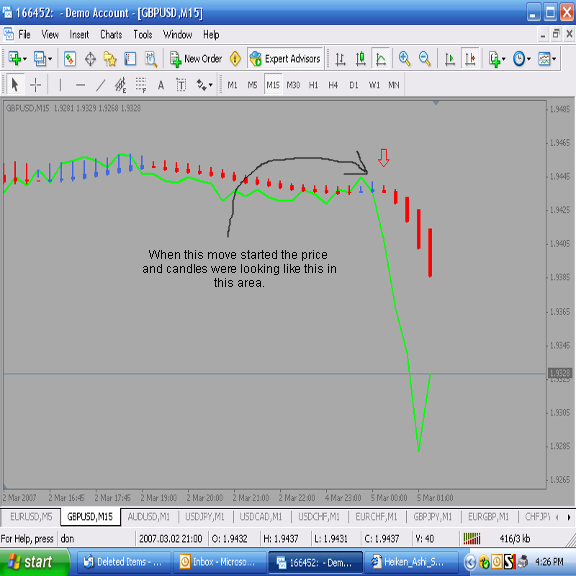
Attached is market action today. I am showing you Cable/$$$ on a 1M, 5M and 15M. See the entry on the 1M. See how it confirms with the 5M (small red wick on a blue body). This is a great indication in change in direction by the way. See the price moving/pointing towards the 5M. You want to this this on any longer TF regardless.
Let me say that again. You want to see the price moving/pointing towards the HAS candle. This action of course is what drives the candles to change color in the first place.
Now look at the 15M It really wouldn't look like this on the 1M TF since this is AFTER THE FACT. But you can see the area I am showing you denoted by the arrow. Again the most important thing to notice on this longest TF is not the color of the HAS candle but the direction of price in relationship with the HAS candles.
Today I booked 55 PIPS on Cable/$$ and 383 PIPS on Cable/Yen all within 2 hours of market open.
"If I was a rich man dada deedie dada dedie deie dum?"
Hey Steinitz, Congratulations on starting a great thread, I’m sure your onto something good here, also the way that you have patiently explained and answered questions is a credit to you. I wish you well in your trading and will follow your thread with interest. Best Regards, COSMO
Ranging markets are a problem from any trend following system. One way to avoid getting stopped out when looking for new set-ups is to look at longer trends that are already in place. Take a currency for example on a 1H TF. Now it's been trading down for some time (red candles) now and the wick:body ratio is ok and not showing much change in momentum.
Go ahead and get on the 30M TF and look for the candles to go blue. As soon as the candles are going blue (contra-trend) wait for the blue ones to start losing momentum (smaller candles etc) and get in short on the FIRST red candle.
What you have done is re entered on a sold down trending move at the right time!
If you are talking about the "bands" and I understand you correctly those are the "line charts" on my platform. I use them because thay make my HAS candles stick out better, visually and I like how the lines will POINT to the direction of trend.
I have been setting this up and trying to test the smoothed HA out, but I just had a few questions.
First of all, lets use the 15m, 30, 1h timeframes. So you start to see blue candles on the 15m chart and wait for the 30m chart to start forming its 1st blue candle. Wait for the candle to finish forming in the 30m TF and then enter as the price moves upwards from the HA candle. All this is done before the 1h candle has started to become blue. So now you are in and the 15m candles are starting to go red, so you wait till the 30m candles start to go red, and exit BEFORE the 1 hr candles become red because that way you will still have profit. Now that you have exited, HAS A PERFECT SHORT opportunity arisen? and do you enter a short position immediatley?...I say this because for you to have exited form your long position, you will have had all the same confirmations as you would have had if you were not in any position and waiting for the sell??
My second question, is how do you get those bands on the charts that touch all the wicks of the HA smoothed candles?
Any help on either of these points would be greatly appreciated.