George: looks to me like there is an error in the buyALL12 and sellALL12 scripts - e/g is on the same side as the jpy pairs, but it is inversely correlated to them. Either this should be removed from both scripts, or changed to the same signal as Uch and Uca.
Ignored
eagle, it's not really inversely correlated with them...and it's only correlated part of the time. It's rather independent. I've often closed it as a loser after running the scripts. Maybe we should just not include it? Instead, we could add NU to form a new GROUP of pairs that do correlate well. I'll modify some scripts accordingly. Try both, and see which works better for you.
I'm attaching an image that shows 16 pairs on 1H TF so everyone can see currency pair correlations after 4 September that I used originally to compose the 2 groups of related pairs. I've also included T3/RSI indicator.
George:
I added your template, but it doesn't look like the chart from your post #31. Attached is what appears when I add it. Would you attach a template that will result in a chart that looks exactly like yours?
Ignored
Sorry, eagle. Try this one; it's the closest one I have at present.
Is the basket bars indi a major component of your system?
I was using it earlier today and noticed that it may repaint? Do you have that problem as well?
Slade
Ignored
Hi Slade,
We use price action tick reversal, the BasketBars indicator, and T3/RSI for exits. BB shows entire GROUP price action. When we are in open trade, we look for tick chart reversal, RSI cross T3 moving average and BB to change color.
Individual bar color dot does seem to change right at the close of candle sometimes. Usually a second color dot is added to first dot, which indicates a MIDDLE condition. Not sure if that is actually a repaint--perhaps the indicator is coded to do that for previous bar as present candle tick data changes.
Great thread will be following it closely, it is great that this type of trading is being taken further, have been using T101's with good results. The problem with correlation is that it is fickel, the patterns that are observed now might not be seen in 6 months time (S&P USD/YEN). Are you creating systems that are tuned to the current market. That is actually quite interesting, the thing is that one must be extra carefull when it goes out of step, then look for new patterns.
Thanks
P.S You say you use fractals, are you just talking conceptually or do you have deeper insights if so could you share (I'm specializing in chaos :-) )
I've been experimenting with various correlations between currency pairs. One relationship that jumps out is between USDCAD and USDCHF. These two currency pairs in the latest historical timeframes tend to move together, opposite JPY pairs group. See:
This leads me to another groups division into two opposing groups of 12 JPY related currency pairs vs. just 2 pairs (UCa & UC). I opened 14 charts, and displayed them all together for comparison on multiple timeframes. Amazing! Only 2 of 14 trend opposite the other 12. So I revised the TRADE scripts to either BUY 12 and SELL2--or SELL 12 and BUY 2. I've been testing these for a limited time with good success for GROUP entry trades.
For scalping, I open entry trades for all 14 pairs...then double click on MT4 profit column to bring losing trades to the top. Monitor for pairs with greatest loss, and close those trades for a small loss if T3/RSI indicator shows a trend direction opposite chosen target direction. Cut your losers short, and let your winners run.
I realize this is fairly complicated; that's why we need an EA to automatically complete the entry process, monitor open trades, and exit process. Nevertheless, I gained around 300 pips profit trading the open of the lackluster Asian market this morning.
Please try them out, and let me know if they work well for you.
Prosperous regards,
George
Ignored
Do you by any chance have same sort of scripts for EURO pairs and/or GBP pairs ?? Regards, John
Since S&P and usdjpy is correlated, what do you think about using it as a proxy to determine buy/sellALL JPY pairs?
FXPro has S&P charts.
Ignored
Hi eagle,
Not an effective strategy. No reliable proxy pair exists. Decision to use BUYJPYpairs or SELLJPYpairs is made from GROUP TREND and embedded countertrend info--and Heatmap JPY group long and short numbers. We are currently using BasketBars v1.5, and searching for GROUP MA indicator. hndymann has posted that, and I asked him to PM me with link to indicator. As soon as I receive that, will post it here.
Not an effective strategy. No reliable proxy pair exists. Decision to use BUYJPYpairs or SELLJPYpairs is made from GROUP TREND and embedded countertrend info--and Heatmap JPY group long and short numbers. We are currently using BasketBars v1.5, and searching for GROUP MA indicator. hndymann has posted that, and I asked him to PM me with link to indicator. As soon as I receive that, will post it here.
Great thread will be following it closely, it is great that this type of trading is being taken further, have been using T101's with good results. The problem with correlation is that it is fickel, the patterns that are observed now might not be seen in 6 months time (S&P USD/YEN). Are you creating systems that are tuned to the current market. That is actually quite interesting, the thing is that one must be extra carefull when it goes out of step, then look for new patterns.
Thanks
P.S You say you use fractals, are you just talking conceptually or do you have deeper insights if so could you share (I'm specializing in chaos :-) )
Ignored
Hello RedPadisha, and welcome. Thank you. My correlation research extends back over 20 years. Of course it must be tuned to the current market for greater effectiveness...but we first examine longer TFs using Heatmap and price action charts for the big picture. Yes, long term trends may change...and this system may change to reflect those market shifts. Backtest my WAVES system, and let us know what you discover.
Fractal has many meanings. Here's the meaning I intend: A fractal (image) displays self similarity, regardless of scale. The whole form is contained within each part of the whole. The fractal branch looks like the entire tree structure. Nothing chaotic about it, rather sublime order manifesting.
In the forex MARKET fractality manifests in multiple time frames, and in groups of affiliated currency pairs which tend to trend together. In my WAVES system 14 pair GROUP, the two major subgroups are the JPYpairs group (JPY pairs plus 6 associated pairs) and the UCa+UC group. This my recent discovery is HUGE for trading purposes.
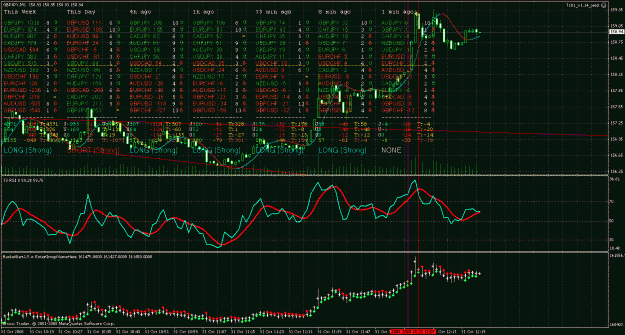
Here's a live account trading example from my wife. We had just returned, turned on trading computer one hour before New York open to see a trade setup in progress. The image is attached. She saw 5 LongStrong Heatmap signals, from 4H to 1M timeframes. JPY group buy green profit numbers were all positive. RSI peak circa 50 at 1158 was followed by RSI X T3 moving average at 1159, and red BasketBar turned to green, then HMA changed color from red to green at 1200 GROUP trade entry using BUYJPYpairs script. Only 13 pairs executed. She exited after only 1 minute using CLOSEALL, capturing 62 pips profit. Not a textbook example of WAVES system due to premature exit. She could have simply held until 1207 to take profit, capturing more of the potential trend profit.
She then made another long GROUP trade entry at 1204 as momentum rocketed up evidenced by steep angles on price chart and RSI, and JPY green pips profit numbers on Heatmap continuing to increase rapidly. Monitored profit progress until tick chart peak, and Heatmap JPY group numbers began to decline; she CLOSEALL exited with 384 PIPS profit in 3 minutes! This performance from someone who knew nothing about forex trading 1 year ago. Both these trades had only 2 losers.
Yesterday I personally made around 600 pips profit scalping one currency pair in the European session.
George, these setup screen shots you've been posting are incredibly helpful. Do you have any comments on good money management during times when the setup looked good but things went sour? I'm trying to get a feel for how much of a leash I should be giving some of these trades.
I realize people's tolerance for drawdowns will vary by individual, but I've come to realize it's the money management aspect of trading where I lack the most discipline or possibly intuition. Any thoughts on building a strong foundation in that regard when it comes to this strategy would be appreciated.