Good evening to all,
Here's another screenshot attempt. Wish I had a Mac!
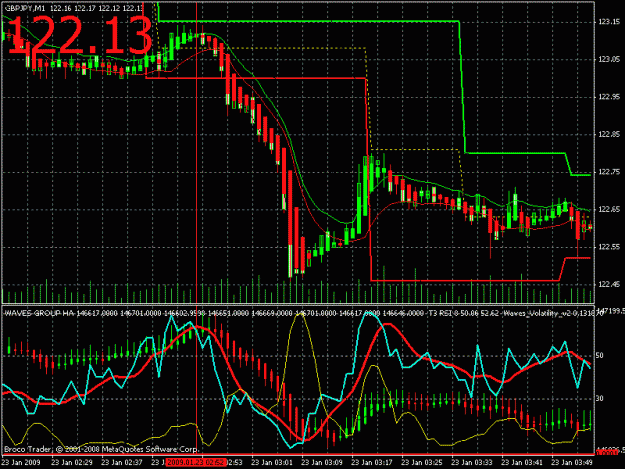
Here's a great example of WAVES system. The vertical red line at 0252 shows overbought RSI divergence peak and cross. The trading entry is 3 candles later, when the HA candle breaks out of the MA channel downwards with increasing momentum. There was a conservative exit at 0311 when the red HA candle changed color to green. Profit about 110 pips in 16 minutes. Questions?
Regards,
George
Here's another screenshot attempt. Wish I had a Mac!
Here's a great example of WAVES system. The vertical red line at 0252 shows overbought RSI divergence peak and cross. The trading entry is 3 candles later, when the HA candle breaks out of the MA channel downwards with increasing momentum. There was a conservative exit at 0311 when the red HA candle changed color to green. Profit about 110 pips in 16 minutes. Questions?
Regards,
George
Attached Image (click to enlarge)