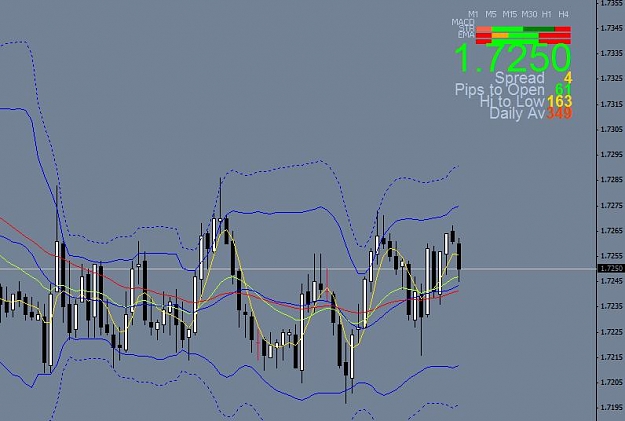
I think the problem here is WHEN you establish your trend is a personal thing. I personally couldn't imagine a 20 year starting point in the past as a reference point to DAILY trading. This is why there are different time frame charts, a zillion different MA's etc. The trend is simply RELATIVE to your trading activity and long term or short term goals. Also, the chart you attached is not in a downtrend. It found a bottom and is going sideways with slight channeling. I think the relevant answer is to figure out how long you intend to hold the trade (hourly, daily, weekly etc.) and then figure out how far back to establish your trend. I hope this helped. Happy trading!
Brinks truck on standby, ready to kick it in reverse!