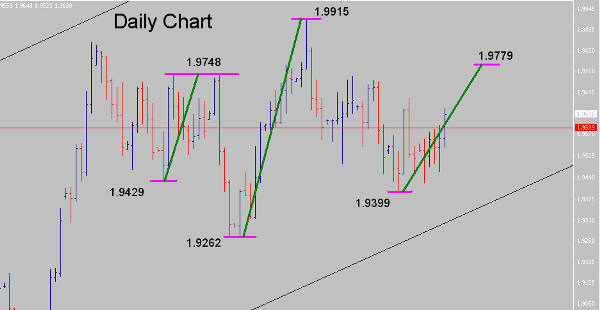
DislikedThe chart I posted was to review the move that had taken place and to show the Fibo Levels that were reached during this move.
I post many charts and sometimes they are just colorful, and on occasion have no meaning to others.
I apologize for the simplicity of my analysis, but I use about 20 different chart setups, but they all work within each other. It would be very confusing too me also at times to see my charts, I will try not to post so many different views and keep things less cluttered.
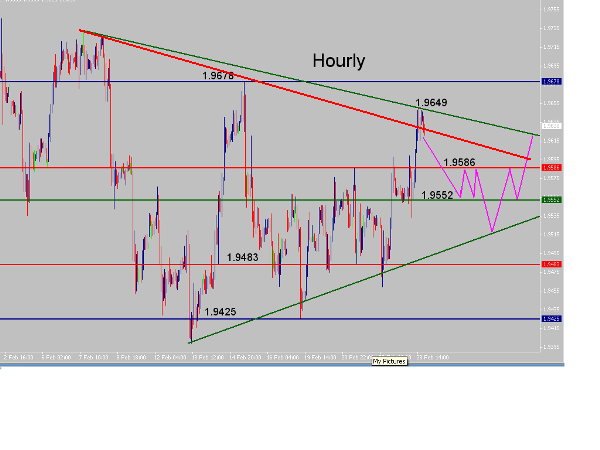
I have one other chart that shows the Flag formation we are in now.
I do not feel we will see 1.9735/47 area until we re-test 1.9589, and 1.9562 areas. It may even go down and re-test the 1.9535 area before going back up to the upper line of the Flag formation.
The breakout will take place near the 1.9587 area, I state this because it is the median price of the range the Cable is in.
There has been no indication of a trend change to the downward side, and as far as I can see we are still in the same range that it has been in since the High at 1.9846 on Dec 1st 2006 and the Low at 1.9262 on Jan 8th 2007 (this would place the median price at 1.9554).
If you were to use the Low at 1.9262 and the High at 1.9914 the median would be at 1.9587.
I hope this explains somewhat about my chart posting.
I apoligize for any confusion on the matter.Ignored
- #7,046
- Feb 25, 2007 9:47pm Feb 25, 2007 9:47pm
- | Joined Dec 2006 | Status: Trader | 1,104 Posts
trading on demo is not trading
- #7,048
- Feb 25, 2007 9:53pm Feb 25, 2007 9:53pm
- | Joined Dec 2006 | Status: Trader | 1,104 Posts
trading on demo is not trading