|
Joined May 2008
|
Status: www.locksmith24toronto.co m
|238 Posts
Dear BRV,
that was the second week I tryed to trade by your method , with low success , in order improve that I would like to ask you if it's not too much trouble to post how you traded in the last week , when you got into position \ when you got out ... I'm a little confused here , but I see the great potential of this trading method - I really like that bucket pattern that happens all the time , I really would like to see your technique in order to improve mine , since I keep failling in the entry place with the bucket .
about R&S , when I'm looking at the eur\usd chart I can see that the price in between some levels that each one of them can be important and effect the price , so for the long term how can I now to which one is more signifficant then the other , I attached chart with examples.
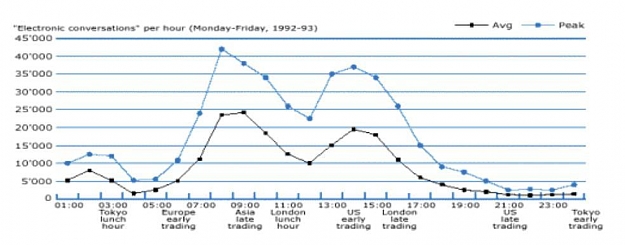
to another thing , correlation - when I'm looking at the charts I see that some of the equities are in intereting levels and might be ready for reversal \ corretion , what do you think about oil\gold\nasdaq and their impact on the forex market , looking at them on the weekly charts.
"Good judgment comes from experience. Experience comes from bad judgment."
Jim Horning
So, it follows that you should make the most of these experiences. Some days you win, some days you learn. I have found the most efficient way to develop as a trader is first to write a trading plan. Then, execute the trading plan as best you can, whilst keeping a journal and logging all trades (with their vital statistics for you to come back to later). Review your trades, take screenshots of the trade idea, then the lower time frame price action, your entry, then where you exit, and even what followed after. Then you can see what works and what does not, and after a while when you have built up enough data you can tweak the trading plan. No-one ever got profitable in forex without working from a plan. Some people might have it in their head, but for the most part writing it down in black and white is the way to go. You might think that you can get away without doing this, or it sounds like too much work, or these rules do not apply to you. Well, if that is the case then you might as well quit now, because there are no shortcuts.
Ignored
thank you my friend , I actually writing my trade plans a lot of time as I trade on bigger time frames , I figured that with that method (15min-1hr TF)you won't have the time to write your trade plans since you have to be really quick on the mouse .
which leads me to another question about that bucket pattern -
every time you see a bucket , do you draw a new s&r on it's buttom ?
what do you do when the next bucket appears do you dump the old ones?
since I've noticed , when backtesting , that you to draw a new s&r lines each time a bucket appears - and every set of lines is good for 2 bucket patterns or so - at least on the 15 min chart.
|
Joined May 2008
|
Status: www.locksmith24toronto.co m
|238 Posts
the reason I think markets r ready for reversal \ correction , the only question I have is how will it effect the fx market and espexially the eur\usd.
|
Joined Sep 2008
|
Status: Lucky Man
|2,267 Posts
The more time I spend round here the more I am convinced that No Brainer is definitely a misnomer for this stuff. Coz in fact it is Experience-based HyperBrainer trading. No indicators, no handrail, only you and the prices. It is pure pattern recognition, an ability of our brains - and it is something that cannot be automated or expressed with mechanical rules. So Barak, don't get discouraged after two weeks of trying. Maybe after 22 weeks.
forget about tomorrow, just steal away into the night
|
Joined May 2008
|
Status: www.locksmith24toronto.co m
|238 Posts
hi all ,
I still hope for comments to my last posts... however I wanted to hear your opinion on my trade plan for the coming week .
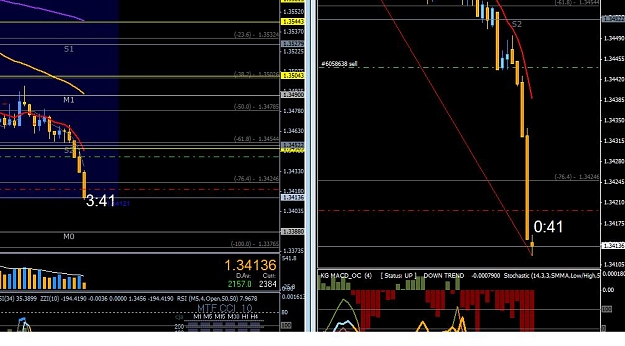
the eur\usd looks to me like a continue south , 1.3445(1) level was broken - which was the last place price respected , now it became a resistence as price checked it again and couldn't close above it , so it looks like a good place to go short for trend continuation and stop willl be above the tail of the last high bar.
for the short term , we also can see a bucket , and I think it will be wise to try and take a scalp long for 20-30 pips at point 2.
point 3 - an historical weekly resistance , this is where I will open another short when \ if it will break .
Could you please confirm if I'm understanding what you do correctly. I've included a EUR/USD chart and marked the levels as I see them.
Coming from mostly trading fundamentals, I'm finding it difficult to come to terms with what appears to be random entries off S&R. However, looking back at the charts I can see that these S&R levels do hold up quite well. The problem I have, and it stems from my usually trading with a fundamental bias, is what to do at each of these levels.
So lets say tomorrow we see price rise up to 1.3450 and the hourly close cannot penetrate that level, I'd then place a short trade with a stop +40 above the next level, which would place the stop at 1.3540. Or does the stop only go a few points above the next level?
However, if price should stay around 1.3390 and an hourly close seems to be having a difficult time penetrating it, then a long entry would be considered with a stop just below 1.3255, with possibly adding another long if price heads down towards the 50% fib. level of the recent wave.
Is this basically in a nutshell what you do. You have no bias, you just trade the levels as you see them. So if you did place a short at 1.3450 and it reversed on you and closed on the hourly, penetrating the 1.3450 level, you'd then go long aiming for the next resistance level?
I tried this on Friday and most of the trades got stopped out. If however I'd have had a short bias, things might have been different. Or is it just the case that in the current climate of panic, it's probably better to stay on the sidelines until everything has calmed down?
My thinking on the subject (abstract way of thinking about it) is that it is the top of the area where buyers and sellers fought it out at a previous pivot, that is, the other side of the pivot inside the bucket. We normally think of support and resistance existing at the outer area of the bucket, at the extreme high or the low, and these areas have significance because there will be bunches of limit orders where buyers want to get in when they missed out earlier, and sellers who got it wrong will want to dump their positions at break even. But it appears that the area inside the bucket (inside the high or low) also has significance, as this area marked where the sellers in the market were exhausted, and where buyers who weren't able to got in at the bottom would deem to be good value and would have set orders. Observe how often price does this - it will appear to make an impulsive move after consolidation, late comers will join the party when the initial thrust is almost over. The market movers are sometimes early in the move or dead on, but they are never late. People playing the support and resistance (like us) will take cues from the price action around these prospective support and resistance areas and get in just as the initial thrust is occurring, allowing us to catch a decent portion of the move if we're early enough and we get our analysis right. Latecomers (who consistently lose and feed everyone else) see the move, get all emotional and jump in, only for price to retreat back to retest the top of the prior consolidation area and collect the orders that are placed there, sellers are able to get out cheaply and buyers get in cheaply (all paid for by the latecomers), and then price advances upwards if it is so inclined.
just let me see if I got it right , you get in for long \ short where the red arrows are ?
but how do you know when to get in ? it can sometimes look like a false signal - yellow arrows , what kind of stop I need to use ?
and what is a good take profit for this kind of trade?
Ignored
Hey Barak, think you might be making it too complicated, more than it really is. Just a simple and basic pattern that happens quite frequently....you seem to have the handle of it here. I wouldnt try to overanalyze it; cuz I dont think Ive ever done a ton of research in it to be honest with you anayway; not too sure I would have anything else to tell you.
PLEASE DON'T MAKE ME LOG OUT OF THIS THREAD....Is it becos market is in zzzzzzzz'zig zag' position, that why we have to node our heads for another options.....please nothing in this business tends to be smooth lets just move on,,,,PLEASE!
Ignored
hahaha never got around to resppnding to this but no blasphemy intended; really. If it helps it helps, otherwise, not worth looking at .
Barak, I did see your post but to be honest I didn't want to say too much as this is BRV's thread and he knows exactly what he means (and if he doesn't then we're being led by a lunatic, run), I just offered a slightly different way of thinking about it. The examples and explanation that he has given appear to be quite clear from my point of view - it is similar to the 'near-term' support/resistance retest method that he talks about in the pdf, just with a slightly unconventional way of identifying the support and resistance; using the inside of the bucket as opposed to the outside of the bucket.
Look at a pair that is in a slight trend but chopping a bit (as in the EURUSD example which was in a slight uptrend until the last few hours, so you might just look for support bucket plays), look at the areas where prices turned, mark off that level and then look to the left and see if it correlates with any 'traffic' and what was going on within that traffic. It doesn't happen all the time but enough that you should be able to see it. This price action occurs (or can occur) within wedges, within cup and handle formations, within head and shoulders formations, within flags, within trends, within ranges. Sometimes it'll undershoot, sometimes it'll overshoot but it is hard to ignore the existence of orders in these areas.
About stop losses and profit targeting each situation is different, each currency is different, each day has different volatility and each personality is different. For instance, you could have a higher time frame bias to the long side and want to use 'the bucket' to get in as it would offer excellent R:R and the success% you feel is good because the method you have tested the higher time frame bias upon is tested or based on firm fundamental theory, you approach the potential support offered by the inside of the bucket and you see something you like so you take the trade. In this situation you might be more willing to withstand a bit more of a stoploss because not only does the lower time frame price action (reduction in momentum, 5m doji, 15m abandoned baby, whatever) have context with the probability of support existing there because you have seen these inside bucket formations hold time and time again, but you also have the higher time frame bias. So if it did break down you could sit on it a while longer, it may be an overshoot or there is more support below where buyers may kick in. Were you just hoping to scalp out a few pips then once the area was surpassed you could close out the trade as soon as you felt the trade idea was no longer valid. This is a personal thing, I like hiding my stops behind market structure, but I know others will exit if it goes against them 20 pips as they hate seeing red of any sort in their account. Whatever works for you. As for profit targets, doesn't that depend on so many factors too? I know some traders do very well using a set number of pips SL and TP, the same across every pair but I can't live with that. Support and resistance is the name of the game so I plan to place my entries on S/R, my SL beyond S/R and my TP before S/R. It is entirely down to the individual and the situation. BRV can't tell you how to trade, that is up to you to figure out for yourself.
Hope this helps,
PS. think of areas of consolidation being retested, there is a reason for this - the market heads to where the orders are. Price moves when there are no transactions taking place between buyers and sellers. So if price is falling it will keep falling into buyers come into the market and this will occur at a point where they believe value exists in the market. Their orders, and their perception of value, are very often found at past points of congestion.
Ignored
good explaination and I hope I've always done my best not to prove myself as a lunatic
that was the second week I tryed to trade by your method , with low success , in order improve that I would like to ask you if it's not too much trouble to post how you traded in the last week , when you got into position \ when you got out ... I'm a little confused here , but I see the great potential of this trading method - I really like that bucket pattern that happens all the time , I really would like to see your technique in order to improve mine , since I keep failling in the entry place with the bucket .
about R&S , when I'm looking at the eur\usd chart I can see that the price in between some levels that each one of them can be important and effect the price , so for the long term how can I now to which one is more signifficant then the other , I attached chart with examples.
to another thing , correlation - when I'm looking at the charts I see that some of the equities are in intereting levels and might be ready for reversal \ corretion , what do you think about oil\gold\nasdaq and their impact on the forex market , looking at them on the weekly charts.
have a nice weekend,
hope for your answer ,
Barak
Ignored
Hey again Barak - it took me about 2 1/2 years before I started killing it so please dont get discouraged after one week of moderate success. There's a lot of stuff to delve into here and just stay with the basics. I would read some of the main articles and the biggest thing is:
OBSERVATION AND EXPERIENCE
It takes time. There is a huge myth out there that trading FX is the key to unlocking billions of dollars and it can be done overnight.
I'll see if I can keep on posting examples here but honestly I'm getting hit hard here lately with questions. I'll do my best to post when I can but in terms of whats more significant than other times it becomes a matter of recongnizing these things over and over agian and realizing when its okay to go and when its not. I'll see if I can get around to posting some stuff (Im not home now) but will try later on tonight. Thank you,