nice trading.
i was just wondering about these trades
Trade 1 - Enter on rejection of short obviously. But my short is at 663.
Question 1 - Isnt 3 pips awful close to call it a rejection?
The candle close is at 650, would that have been a better entry?
Q1a - Where was your SL on this one?
You closed that trade at 583. Interesting! Using a 1 bar exit strategy would have taken you out at 610.
Q1b - How did you decide to close at 583? Lower TF? or the 1HR PB yesterday marked with the up arrow.
Trade 2 -
Q2 - was this an addon trade to the first?
Q2a - Enter when the next candle broke below the initial entry?
Q2b - Again what was your thinking on exit and SL there?
Trade 3 - Another add on i assume
Q3a - were those 3 trades all off the same 3 candles?
Q4 - Did the later rejection of the pivot interest you at all, marked as 4?
Thanks for posting the trade and good luck!
J
Ignored
I figured someone was going to ask for a bit more detail than I've been offering, lol. Truth is, I can't remember those trades. I've been cryptic due to the extreme time constraints on my own life. I spend very little screen time due to other projects I am involved in. That said, I decided to start posting net results as an encouragement to others that it is possible, using Bo's system, to generate fairly consistent results.
I will endeavor to give a bit more thinking in future, if time allows.
for example went short @ 450 on break of low after frankft open, closed @535 cuz I didn't want to lose any more money (trading live) net -85 pips.
Would you please explain your thinking process as you take trades as Bob and Sherm do .
It is impressive that you get such results but it will be more interactive and educational if you share your thinking behind the trades too.
Ignored
Please see my last. Also, in answer to another question, I have learned, after many frustrating, painful and expensive encounters with the stop bandits not to set hard stops. Occasionally I will set trailing stops, or extreme measure stops if I'm going to be away from screen for extended times.
btw, no way am I at the level of some others here, I don't even know how to post a chart, lol.
I have managed to quadruple equity in just over a month, using Bo's system to add structure to bare naked price trading, which is all I've been taught up til now.
|
Additional Username
|
Joined Dec 2007
|179 Posts
I'm interested in more about the price trading but realize that this isn't the thread to discuss it. Maybe you could start your own thread to show some charts. After we teach ya how .
Please see my last. Also, in answer to another question, I have learned, after many frustrating, painful and expensive encounters with the stop bandits not to set hard stops. Occasionally I will set trailing stops, or extreme measure stops if I'm going to be away from screen for extended times.
btw, no way am I at the level of some others here, I don't even know how to post a chart, lol.
I have managed to quadruple equity in just over a month, using Bo's system to add structure to bare naked price trading, which is all I've been taught up til now.
Ignored
Thanks for starting to share your thoughts behind your trades. As Bob mentioned you are very quick at picking up his system and apply it succesfully. Probably your previous study of naked price has helped you to
have a good foundation to learn Bob's system quickly .
Bob always mentions that the most difficult part of his system is to read and interpret price action in the action zone .
I think it would be very interesting if you explain what you mean with reading the naked price and then we will probably get some comments from Bob too.
thanks for your reply again.i will run test what i have read from the pdf on a demo account and see what i can come up with. i will post replies on here once i start getting results.thanks for the help so far.
hello,thanks again for the reply.i will test run all i have learnt so far from the pdf on a demo account and see what i come up with..and i will keep you informed as i see results.thanks for the help so far...happy pips taking
Thanks for starting to share your thoughts behind your trades. As Bob mentioned you are very quick at picking up his system and apply it succesfully. Probably your previous study of naked price has helped you to
have a good foundation to learn Bob's system quickly .
Bob always mentions that the most difficult part of his system is to read and interpret price action in the action zone .
I think it would be very interesting if you explain what you mean with reading the naked price and then we will probably get some comments from Bob too.
Ignored
LOL !! Guys, really, I'm no thread starter and having me hold forth on any level of forex theory is blind leading sighted. Today was a good example of "extreme measure" stops tho. Hard drive crashed !! fortunately expected I was having probs so set 25 pip stop loss on last short, was fortunately able to net 65 pips, shrinking the loss for the day to -20 net, I think only the second net daily loss since I started trading this system.
Anyway, to show you how much you don't want to know what I'm thinking, I have to go remember how to recreate the fibs I was using, lol.
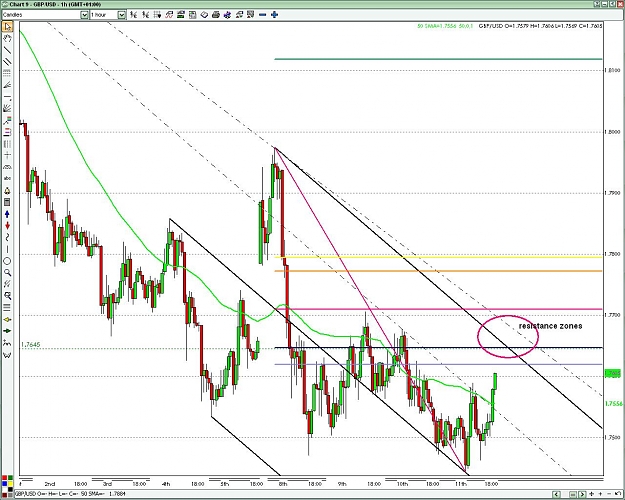
Dont get too excited about going long GU. It's still trading within its downward fork, and will probably hit some turbulance around its 38.2 and 50% levels.
hello,thanks again for the reply.i will test run all i have learnt so far from the pdf on a demo account and see what i come up with..and i will keep you informed as i see results.thanks for the help so far...happy pips taking
Here starts my learning and here is my first questions for Bobokus ( mainly first question ) :
Picture 1.
We can see that this intraday high on this picture is also pip by pip touch at longer term retracement fib.
1) As we see false breakout, do we take long trade and SL is below previus candle low?
Or
2) We don't take long trade because we saw rejection from longer term fib?
Picture 2.
On this picture we can see swing fib from last session.
1)Having this swing on chart it also shows long trade trigered because swing and previus intraday levels is holding price too?
2)We get false breakout, but our SL is below previus canlde low ?
Picture 3.
You move Your Swing fib at points where i have paint green lines.
Why are You not drawing swing fib on swings where is my red lines ?
What is criterias for chosing right these green swings and not other ?
Thank You for answers,
Best wishes,
Tom
Ignored
In your picture 1, the entry would be 2 candle before the one you have circled, the reason is it opened above the Long level to indicate a long condition existed, it turns out to be a false signal since the market reverses. The Intraday fib(Lime) for the previous day was bullish and we would have been looking for a bounce or long breal in the next day. It happens but just turns out to be false. After a few hours into the trade without it being able to make any progress and the wicks on top of the candles it would have been wise to pull a stop a few pips off the previous candle lows to reduce the risk in holding the trade.
Picture 2 is the same thing but with the Swing fib measuringthe retracement into the previous days movement, If we got the break from the Intraday long or the bounce we would want to see the swing fibs levels broken as a confindence builder in the long position..even still it turns out to be a false signal.
Picture 3 is from following the markets movement with the swing fib since weve been in a ranging pattern and the Swing can aid in scalping our way through it. Once you had the swing in the previous positions or the starting point on tuesday youmove it to each new wave that forms and if the levels are repected you look for price to go to that swings target range, the reason we didnt use all thos is thats the action from the previous swings levels being repected and once the targets from that are met you can move your swing to where the target was met back to where it started from and just continue that process until the pair moves out from the ranging pattern.
Ill post a few chart examples here and in the next post there are 2 more that will finish it and maybe these will help.
Another thing is dont forget what we were watching for in the first place we still are showing short from the action of tuesday. So far these levels are still being respected as well and evident from today.
If you look back at the posts where I went from looking at the big picture and work your way down to the 1 hour to reset your analysis as we go through this ranging, this strategy can still be used if you feel like your getting out of sinc with the pair.
Going back Tuesday again where weve made the high of the week back to the low of last Friday we now have a smaller retracement into the Daily down trend its small but its there and it gives a very similar picture as my last posts here. If you look at this last retracement now the levels of this are being respected along with tuesdays Intraday (purple fib), if you just want to start fresh and use today as the Intraday which is a valid Intraday measurement and start from here now. From this we still see the pair wants to remain short but showing some signs of life in it now and if we continue to see support levels hold and bounces occur instead of short level breaks we may see some decent retracement into the Daily downtrend. This is still a valid approach if you want to look at it from a reset standpoint.
Ignored
This is where I get confused!
I see 3 possible scenarios.
1.If let's say the price bounce off the retracements levels(purple) that means short and ignore intraday levels(green)?
2.The price bounce off intraday level we go long and ignore retracement levels?
3.We don't ignore any levels and no matter what price might do the only valid set up would be: long above 1.7615 and sort below 1.7505.
If #3 is the answer that means any trades taken between 1.7505 and 1.7615 could be hard to take because this levels are so close from each other.
If you can make some comments on this Bob ,will be very helpfull.
Thasnks Chris
Ignored
You still base your decisions from the Intraday, if we get the long bounce in a downtrending market you have the established resistance levels above price and you need to be aware of those since they will be in the path to the Intraday targets, A break of the Intraday levels short and nothing has changed, the downtrending continues.
You still base your decisions from the Intraday, if we get the long bounce in a downtrending market you have the established resistance levels above price and you need to be aware of those since they will be in the path to the Intraday targets, A break of the Intraday levels short and nothing has changed, the downtrending continues.
Ignored
Bo, Thanks a lot .
Your responses are indeed priceless!
Going back Tuesday again where weve made the high of the week back to the low of last Friday we now have a smaller retracement into the Daily down trend its small but its there and it gives a very similar picture as my last posts here.
Ignored
Glad you brought this up Bo. I had pulled the retracement fib Sept 5th but removed it when its low was broken September 8th. Interestingly the retracement short was respected on the 9th.
Is there a guideline for removing and pulling this fib. I didn't pull this fib to the retracement you mentioned in your last post mostly because I don't have the experience to know if the retracement was significant.
I thought it wasn't.
I guess I'm asking if there are guidelines or if it's a matter of experience.
Thanks for your patience.
Regards
Ignored
We'll thats the purpose of using a Retracement fib it answers the question of what direction will price take now that it has retraced into the Daily Downtrending movement, from what we see so far its still short, that may change tomorrow or in the coming days but right now it remains short and the resistance from those levels is under attack from what I feel are probing trades late today and we may see more tonight. Weve come very very close to a major supprt level sitting at 1.7422 and someone is testing the waters. But the retracement fib we use from the Daily chart I use for its targets as well, Normally I will use it until its targets are met but in this case we may be moving it If its levels break or we get a Daily close above its long level, the reasoning is that we have a lower low after the one were using and if we break the long level of it we will start pulling a new one until resistance is met and we get another fall in price from the perspective of the Daily chart. Then it becomes our new direction pointer again.
But the retracement fib we use from the Daily chart I use for its targets as well, Normally I will use it until its targets are met but in this case we may be moving it If its levels break or we get a Daily close above its long level, the reasoning is that we have a lower low after the one were using and if we break the long level of it we will start pulling a new one until resistance is met and we get another fall in price from the perspective of the Daily chart. Then it becomes our new direction pointer again.
Ignored
Thank you sir,
That clears things up for me.
By the way, Bo, my demo account balance has been steadily increasing since I have been using the methods you've been discussed here.