Hello all
This morning i take short usd chf for 120 pips target.
We have double top, test and retest of upper MLH.
Let se how this works.
Regards
Catalin
why is EJ falling and UJ rising?...usually yen pairs and usd pairs move in opposite directions.
Ignored
Prior to Aug 15 or so, EJ and UJ were moving opposite for a time because EU was making such big moves down. Rather than being opposite (of late), EJ and UJ still do follow each other, as the Daily charts show, but there are some relative differences that occur because of EU swings. If EU swings big enough, it can indeed make EJ and UJ run "opposite" each other, for a brief period until EU stops changing faster than UJ changes.
At any moment in time, EJ = EU * UJ
This is literally a multiplication you can do. For example, at this moment:
EU: 1.4304
UJ: 106.56
EJ 152.44
1.4303 x 106.55 = 152.4234 vs. 152.44 (always within a few pips).
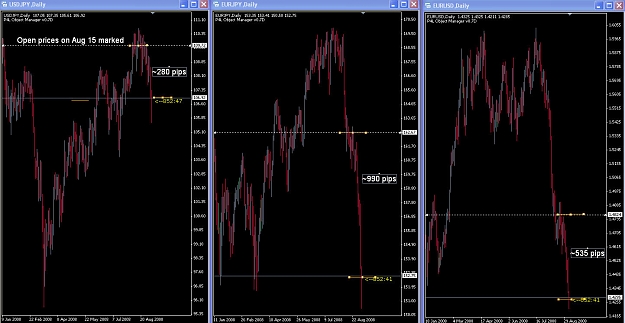
See the charts below. The August 15th Open prices are marked, and they also multiply within a couple of pips. Overall, UJ and EJ have similarities in shape, but the EJ has fallen far more, comparitively. Why? The answer is the EU chart on the right. It has fallen a bunch over the same time period.
Rule of thumb (at this moment in time) looking at an EJ chart:
Every pip that UJ moves, EJ moves ~1.43 pips.
Every pip that EU moves, EJ moves ~1.06 pips
The reason why is just looking at the math of the prices.
EJ = UJ * 1.43 (or more accurately, 1.4304)
EJ = EU * 1.06 (or more accurately, 106.55/100)
On the chart, over the same period of time, UJ fell ~280 pips, EJ fell ~535, and EJ ~990.
~280 * ~1.455 avg over the time period= ~407
~535 * ~1.085 avg over the time period = ~580
~407 + ~580 = ~987 ... very close to my ~990 on the chart.
(All chart measurements and math were approximations).
Prior to Aug 15 or so, EJ and UJ were moving opposite for a time because EU was making such big moves down. Rather than being opposite (of late), EJ and UJ still do follow each other, as the Daily charts show, but there are some relative differences that occur because of EU swings. If EU swings big enough, it can indeed make EJ and UJ run "opposite" each other, for a brief period until EU stops changing faster than UJ changes.
At any moment in time, EJ = EU * UJ
This is literally a multiplication you can do. For example, at this moment:
EU: 1.4304
UJ: 106.56
EJ 152.44
1.4303 x 106.55 = 152.4234 vs. 152.44 (always within a few pips).
See the charts below. The August 15th Open prices are marked, and they also multiply within a couple of pips. Overall, UJ and EJ have similarities in shape, but the EJ has fallen far more, comparitively. Why? The answer is the EU chart on the right. It has fallen a bunch over the same time period.
Rule of thumb (at this moment in time) looking at an EJ chart:
Every pip that UJ moves, EJ moves ~1.43 pips.
Every pip that EU moves, EJ moves ~1.06 pips
The reason why is just looking at the math of the prices.
EJ = UJ * 1.43 (or more accurately, 1.4304)
EJ = EU * 1.06 (or more accurately, 106.55/100)
On the chart, over the same period of time, UJ fell ~280 pips, EJ fell ~535, and EJ ~990.
~280 * ~1.455 avg over the time period= ~407
~535 * ~1.085 avg over the time period = ~580
~407 + ~580 = ~987 ... very close to my ~990 on the chart.
(All chart measurements and math were approximations).
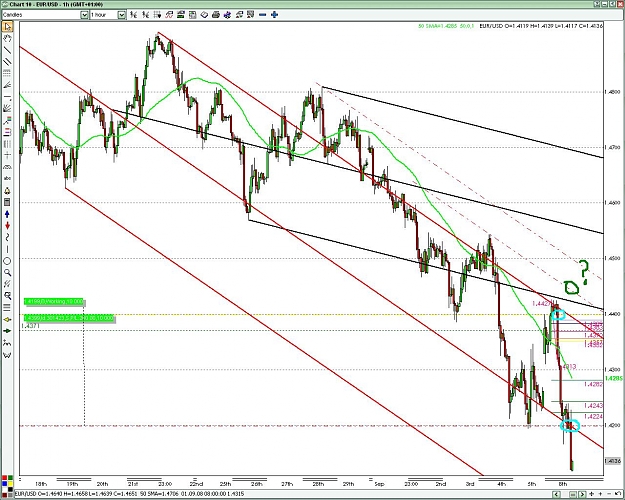
if you have a sliding parallel, is that the new line for entry, or can you use the actual upper, and lower fork lines as a valid entry point, or will price most likely rise/fall to the parallel?
big pipin,
just think of the sliding parallel as a change in frequency of the medianline. If the medianline was in tune with the price action, there will be, at times, a shift or change in the frequency of the price action. It's best to wait and see if the sliding parallel contains the price. If it does, then use this as your new entry point.
yes thanks, I took the short on EU last night, not waiting for the parallel, but i figured that I could try both lines because if I kept good MM, then losing a couple times in a row in order to capture the move would be worth it, and I got in, right in time too.
Its a thin market volume wise in FX too many traders are scared to take any positions that's why they are killing all the pairs. They are giving traders to jump in and once they are in they will trap them. EUR is getting slaugthered b/c no one wants to trade it right now. They are slowly going to rise EUR in coming days and slows kill off UJ. In this market only thing you can do is take some Karmo pills and stay clam
Has anyone tried to use the tool to actually project price points? I did that tonight by creating intersection lines on several time frames with Medial lines. The "Map" it created was pretty amazing.
I put ovals at all of the major areas of median line intersections. On image 1, I drew what I thought (based on trend and S/R levels) the price would "do" tonight. I have been pretty amazed by the results.
Before you ask, yes this is a demo account, but I also have a live money account where I apply what I have learned and this past month it is up about 25% so far, since mid August. I have traded it very cautiously using this tool with a couple of others to confirm trend, etc.
Tell me what you think of the images, which you can verify on the 5 minute chart on your own MT4 systems.
First time I have posted and I hope the images came through fine. By the way, I have entered a TP at 1.3874 eur/usd. Let's see if it actualy hits. Andrew's in his method says you can actually project price using "SuperForks" which is what this is.
Clay
(EDIT)
I chickened out and got out early because it reversed, BUT I got to looking at the chart and the Andrew's lines provided some amazing triangle patterns at the intersections almost exactly where price turned. Don't take my word for it, look at the chart from just a few minutes ago when I re-entered, same TP target. Look at the last image and you can see the triangles I have highlighted.
Personally, I am beginning to believe Andrews was a genious. He was talking (inthe 1930's) about profits of 100's of percent per year in the stock market using his techniques. Again, just go read his course, don't take my word for it. Here is the link.
Also, George Merchal did a DJIA chart which he copywrited It was amazingly accurate IN ADVANCE for about 18 months or so I believe. Here is the link for that too.
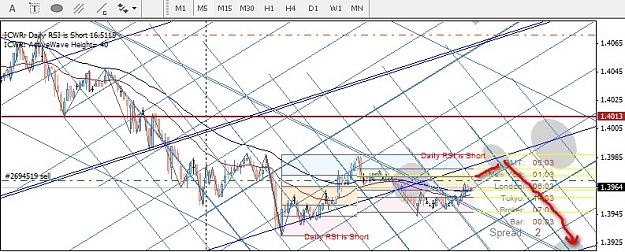
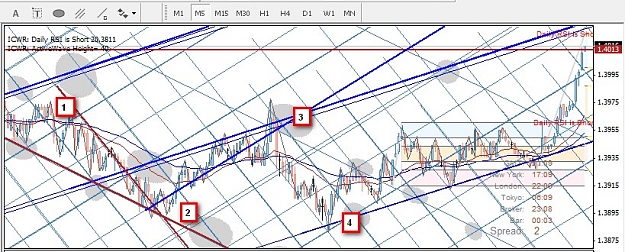
Ok,, I'm still a relative newbie at all this, but the Andrew's lines helped me catch the first point at "1" on this last image. I missed the turns at "2" and "3", but caught a few pips at "1" and "3" even though I didn't catch "3" correctly.
Used a trailing stop from "3" and was bounced out on the reverse at "4," and was asleep so I missed the continuation of "4" even though I knew it had to retest the long term upper S/R level around 1.4013, where it continued and has tested the longer term median line at 1.4028.
Even though I am still learing a lot about them, the Andrew's Median lines are proving to be amazingly accurate. Just need to learn to read them a bit better.
Probably won't post again much. More of a lurker/learner, but I thought this might help spark some more interest.
I can't really tell exactly where your original pitchforks are at with a zillion parallels added. I'm not saying this isn't valid -- I do the same myself -- but you are zoomed in so tight I don't see the big picture. I could spend the time analyzing the chart, but if you could, please post the same M5 with JUST the PF's (no parallels), and then whatever higher TF PF's as well. You said you have higher TF PF's and I see some lines but don't know which points you anchored the PF's at.
The way I have been using these, is to creat some on D1, a few on H4 or H1 depending on which seems to generate the most accurate forks on the most recent high/low swings. Then I switch to a 15 or a 5 minute time frame and create additional forks based on the most recent and pronounces swings. If the high or low is too dramatic, than there is a way to either use a longer origination point, or a Schiff of modified Schiff median line.
Shiff lines basically start from 50% of the distance from the dramatic high/low, and about half way in the "time" from the high to the low, the rest of the fork is normal. None of these images have Schiff lines in them.
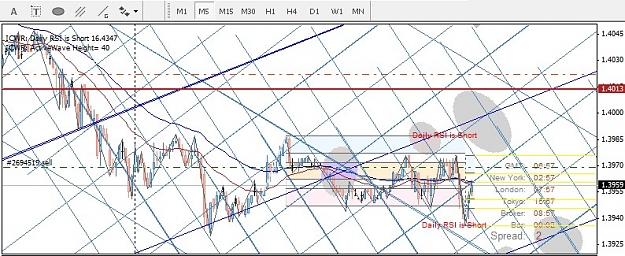
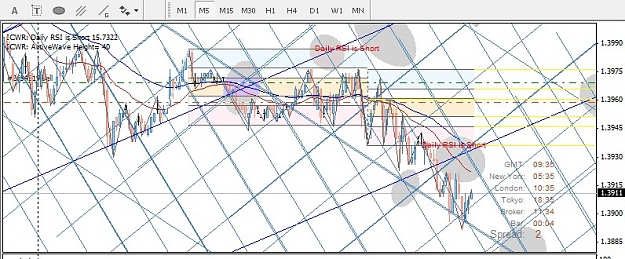
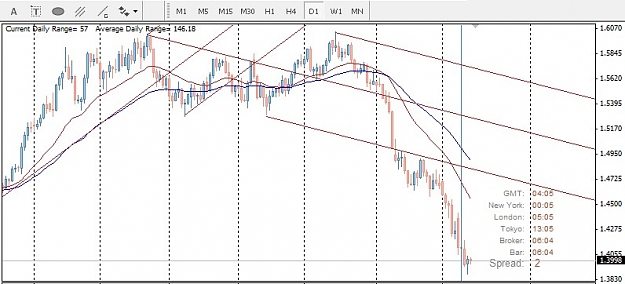
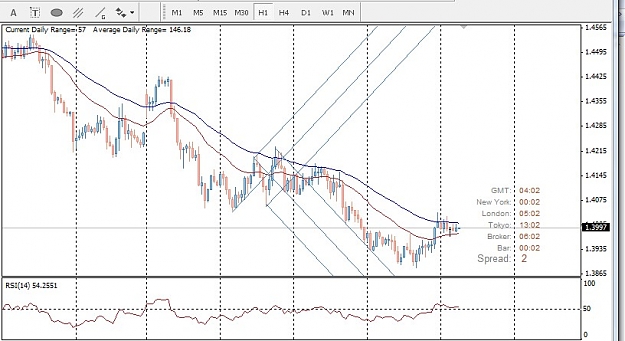
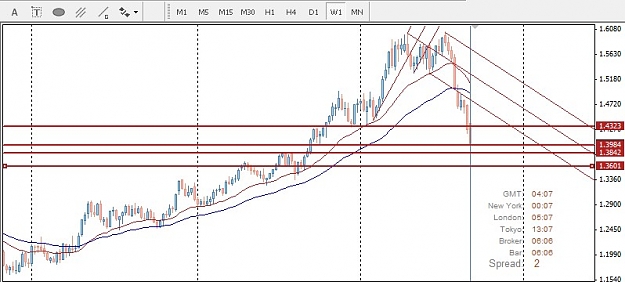
I have attached three charts, with the original D1 forks, including in one the extreme S/R lines from 2007, which appear in one of the other charts I posted.
Next thing I do is look for intersections of the grids formed by duplicating forks. Where you have intersections, they seem to be points of attraction. Tim Morge calls them "energy points" and as you can see, price seems to attract to them. That was how I projected the price decline last night.
The next thing I have noticed is that when there are several "energy points" very close to each other, price seems to sort of "swing" between them. Last night, the price illustrated this when it drove almost exactly between the ovals from number 1 to number 2. Then price drove almost directly at number 3, which was an energy point with several intersections, "way out there" all by it's self.
From there it dropped and repeated it's "swing" through the energy points aroud number 4. Next price followed a median line from H1 time frame and drove back up to test not only the long term SR level from 2007, but also the next higher H1 TF medianline. Along the way, it followed and pivoted very closely to the lower TF medain lines from 5 minutes.
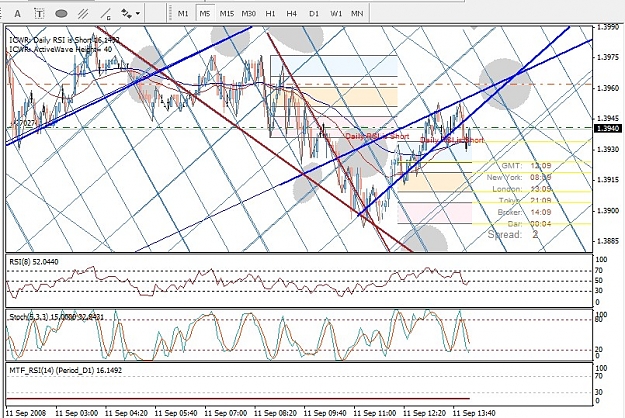
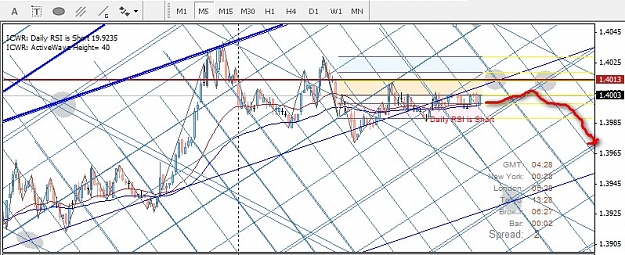
the first three images are the Forks you requested images of from higher time frames. The last image is back to a zoomed 5 minute view including energy points for tonight, and a "projection" of where I believe price will go and approximately when on the chart.
Basically, it should retest the 2007 resistance level at least one more time, based on the energy points, if it does not break, and I don't believe it will, then it should turn back to the downtrend and retest the 1.3890 or so level. It is possible it might show the "swing" behavior and pivot up through the closest two energy points, then back down after point two, becuase there is another energy point immediately behind it around 1.4025 or so, which I didn't mark with an oval yet.
Hope this helps, but I don't want to get into trying to explain all this, as first, I am still learning it myself and second, there are resources (links provided in prior post) that explain it so much better than I could.