Sorry to write something off topic, but the issue I am about to ask about is driving me crazy and I have to find a way to solve it.
I would like to write large paragraphs directly on a MT4 chart (like Phillip or Saka are doing) without taking a screen shot and writing on top of that chart.
Could anyone please tell me if they have found a way to do this? Currently, when I insert text, it cuts off after a sentence.
Thanks Philip. Very helpful your reviews.
This patience thing drives me crazy.
One question please: You mentioned you like to trade the 400, 800, 1200, 1600 most. What does that mean? If it is time, is it GMT? And there was a little part I could not make out, belonging to that part of your review. It seemed quite important.
Sorry to write something off topic, but the issue I am about to ask about is driving me crazy and I have to find a way to solve it.
I would like to write large paragraphs directly on a MT4 chart (like Phillip or Saka are doing) without taking a screen shot and writing on top of that chart.
Could anyone please tell me if they have found a way to do this? Currently, when I insert text, it cuts off after a sentence.
Thank you in advance.
Ignored
Hi
I am using screenshot and then use Windows paint to add text. I dont think you can put paragraphs on Mt4. I will have a look and post something if I found something.
Hi to every member of this great tread.I have a question-I tried to use search but i am not satisfy.Can anyone tells me where can ifind more info about: Inside Top Lows and Inside Bottom Highs .
Thank you in advance
Best wishes to all!!!
Ignored
Check these out fena: Pages 114-115, posts 1710-1711, by tamkras.
This is a good 10-page article on pdf for you all. I'm NOT going through all 4300 attachments to see if it's been posted before.
It's co-written by John Jagerson and S. Wade Hansen, who are the two head honchos from Profiting From Forex. (Since this site links plenty of news articles from their site, I figure it's not spam to mention them.)
|
Joined Nov 2006
|
Status: tradersimon.com
|318 Posts
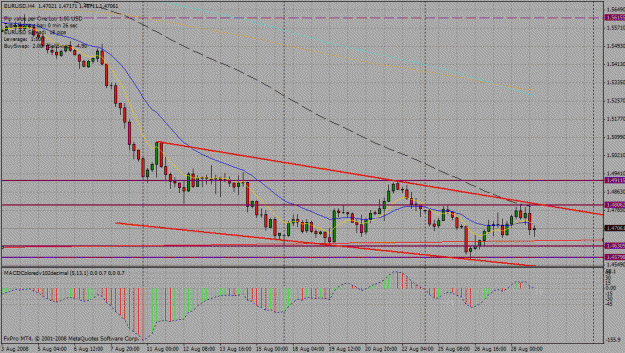
I hope someone can answer this question that I am having trouble with. I'm trying to work out if there is any tradeable rhythm with the eurusd over the last 2 weeks.:
I understand that when price repeatedly crosses the 89 sma, the market cannot make up its mind and its best to stay out.
Does this principal also apply when price continually crosses the 8 and 21 ema's? (as in the screenshot below).
Just wondered how people would apply the system to this chart or whether the last 2 weeks should have been left alone. I have seen Phillip's video on market emotion (lesson 6) where price crosses the 8 and 21 ema's leading up to a triangle breakout, but still not clear whether the above is tradeable.
If it was tradeable, would you:
1. Trade from the trendline up/down to the ema's?
2. Wait for a close past the ema's and trade to the trendline
3. Wait for price to cross the ema's and trade to the trendline
4Aug +32pips Post 16469
8 Aug +52,5 Post 16532
14Aug +57 Post 16611
21Aug +160 Post 16711
26Aug +82,5 Post 16757
Total 383 pips
5 Trades for the month so far. The one for +160 was off support of the trendline discussed in the mp3 with a sHs as well.
Ignored
Unbelievable your most profit trade in August is long, I have shorted eu at Aug. 8th and held it with 1lot in one week to gain 200 pips. It indicates that how good your strategy is
Unbelievable your most profit trade in August is long, I have shorted eu at Aug. 8th and held it with 1lot in one week to gain 200 pips. It indicates that how good your strategy is
Oh, no,you shouldn't use Chinese to post at this thread, otherwise, Phillip will think you talk bad and catch you. If you want to speak with me, you can use PM or IM to connect me
I hope someone can answer this question that I am having trouble with. I'm trying to work out if there is any tradeable rhythm with the eurusd over the last 2 weeks.:
I understand that when price repeatedly crosses the 89 sma, the market cannot make up its mind and its best to stay out.
Does this principal also apply when price continually crosses the 8 and 21 ema's? (as in the screenshot below).
Just wondered how people would apply the system to this chart or whether the last 2 weeks should have been left alone. I have seen Phillip's video on market emotion (lesson 6) where price crosses the 8 and 21 ema's leading up to a triangle breakout, but still not clear whether the above is tradeable.
If it was tradeable, would you:
1. Trade from the trendline up/down to the ema's?
2. Wait for a close past the ema's and trade to the trendline
3. Wait for price to cross the ema's and trade to the trendline
Thanks for any help!
Simon
Ignored
Cant say. But what I do is watch the price at around these MAs, how they behave and decide. Sometimes it bounces off, sometimes it moves right to them etc...
Cant say. But what I do is watch the price at around these MAs, how they behave and decide. Sometimes it bounces off, sometimes it moves right to them etc...
Ignored
thanks for ressurecting my question, PhilinGood
so I guess these situations arent really tradeable without a long observation period.
I hope someone can answer this question that I am having trouble with. I'm trying to work out if there is any tradeable rhythm with the eurusd over the last 2 weeks.:
I understand that when price repeatedly crosses the 89 sma, the market cannot make up its mind and its best to stay out.
Does this principal also apply when price continually crosses the 8 and 21 ema's? (as in the screenshot below).
Just wondered how people would apply the system to this chart or whether the last 2 weeks should have been left alone. I have seen Phillip's video on market emotion (lesson 6) where price crosses the 8 and 21 ema's leading up to a triangle breakout, but still not clear whether the above is tradeable.
If it was tradeable, would you:
1. Trade from the trendline up/down to the ema's?
2. Wait for a close past the ema's and trade to the trendline
3. Wait for price to cross the ema's and trade to the trendline
Thanks for any help!
Simon
Ignored
Simon:
My first step when looking at the 4hr chart is one simple question: Where is price in relation to the 89? Below it = look for shorts, above it look for longs. That first bump back to the top of the channel around Aug21 would have been a good set up to go short. I agree with you that right now the moving averages are converging and price is stuck in about a 60 pip range or so right now. I think a lot is waiting on the oil market (with the storm) and there is no red flag news out today. I think I mentioned a few days ago that I am hesitant to trade the 4hr (1hr rangebound as well) because of all of this and I will try to steal a few on the 5min when I can. But, you aren't doing anything wrong by not doing anything. You're actually doing what the surviving traders do...wait for price to clear this area and get moving again. Don't enter a trade just for the sake of being in the market. I actually have three trend lines along with the 3 moving averages all really close together and don't see any direction right now. So, I'm going to be a 'surving trader' right here and let this pair open up later...
My first step when looking at the 4hr chart is one simple question: Where is price in relation to the 89? Below it = look for shorts, above it look for longs. That first bump back to the top of the channel around Aug21 would have been a good set up to go short. I agree with you that right now the moving averages are converging and price is stuck in about a 60 pip range or so right now. I think a lot is waiting on the oil market (with the storm) and there is no red flag news out today. I think I mentioned a few days ago that I am hesitant to trade the 4hr (1hr rangebound as well) because of all of this and I will try to steal a few on the 5min when I can. But, you aren't doing anything wrong by not doing anything. You're actually doing what the surviving traders do...wait for price to clear this area and get moving again. Don't enter a trade just for the sake of being in the market. I actually have three trend lines along with the 3 moving averages all really close together and don't see any direction right now. So, I'm going to be a 'surving trader' right here and let this pair open up later...
Ignored
Thanks Palmer for your help. It confirms what I was thinking really which is the market is ranging with no clear direction.