Hi Yorik,
On the daily chart, we have a hammer supported by 50% of fibonacci.
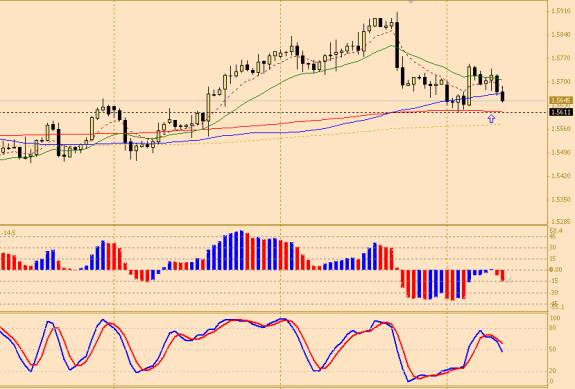
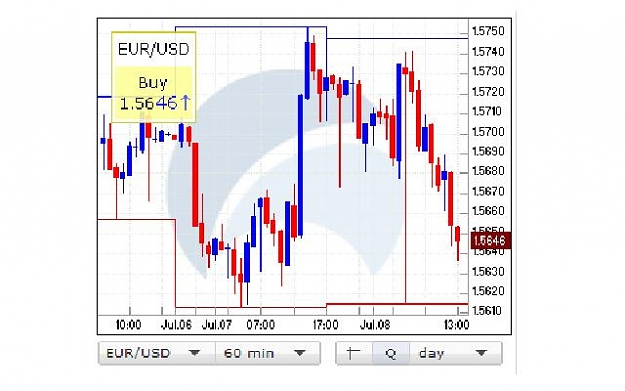
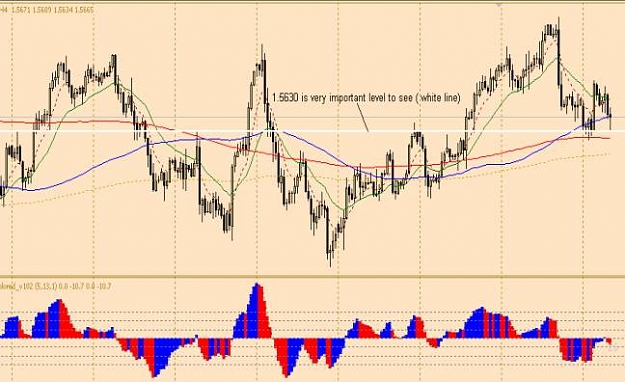
Now, price on the daily chart retraces 62%-79% of fib of the previous candle. And also, we can see price is supported by 89 sma in details on multi time frame (see the 3 charts side by side, 4h-1h-15M).
I wait to see more proofs before initiate a long trade.
On the daily chart, we have a hammer supported by 50% of fibonacci.
Now, price on the daily chart retraces 62%-79% of fib of the previous candle. And also, we can see price is supported by 89 sma in details on multi time frame (see the 3 charts side by side, 4h-1h-15M).
I wait to see more proofs before initiate a long trade.
Attached Image

Being a fxtrader is not easy. Ones must working hard.