Here is my trade for today, second July'08. It is a easy trade. Follow the rule, be patience and money management. It is obvious at 4 hour chart, price is overbought but price is above 89 and 200 sma. So the trend is up at this stage. Now price retraces. At 1 hour chart, I saw price forms a double bottom and supported by 55 ema and 89 sma.
At 15 minute chart, price also forms a double bottom and found support at a central pivot point(CPP = 1.5784).
Sorry, I can not attach a graph. It is too big. I will later.
Enter a long trade at 1.5804 and close at 1.5855
Have a nice day
SRILOBA
Being a fxtrader is not easy. Ones must working hard.
Anybody knows why this month NFP is on Thursday.Usually NFP is on the first Friday of each month
Mike
Ignored
Because tomorrow is American Independent Day, today's ADP NFP has same effect as NFP, I entered a same trade as Phillip, what's wrong is I set sl up the resistant line which is 60pips. And I am not online when ADP released, I should got a fewer loss. I didn't prepare this trade very well.
But it doesn't matter, because I just find another reason caused falure ^_^
You can easily attach your chart by clicking "Manage Attachments" button in "Additional Options" window and upload your chart there while creating a post. Looking forward to see your post
..::hijackxx::..
Ignored
Thanks Hijackxx
But I save my charts on word and when I attach them they said too big. Is there any solutions ?
Thanks
Sriloba
Being a fxtrader is not easy. Ones must working hard.
But I save my charts on word and when I attach them they said too big. Is there any solutions ?
Thanks
Sriloba
Ignored
Try this http://tinypic.com. It will give you a tag that you copy in your post box and it will display your image. But you have to make your charts images in order to work. Maybe it helps you!
My trade for today is based only on technical analysis (4 Hour MACD strategy of master Phillip plus Pivot point system at around London Open of Peter Bain). Also, I know when is the big announcement. It is very important to do a top down analysis from a higer time frame to a lower time frame to have a big picture. From daily chart, I like to see a key levels of support and resistance. At 4 hour chart, I like see the behaviors of price around the moving averages (4 Hour MACD strategy) and I adore to trade a tc pattern as suggested by Phillip. At 1 hour chart, I will observe the previous daily high and low to see if price violates this previous range.
Finally, at 15 minute chart, I put daily pivot point calculated from a previous midnight to actual midnight at eastern time. I always pinpoint my trade at a lower time frame for small stop lost ( 20-25 pips). The best way to do that is enter a trade on retracement.
Like today, I go long when price retraces to the 21 ema ( a high probability trade as suggested by Phillip).
Hope this helps
SRILOBA
Being a fxtrader is not easy. Ones must working hard.
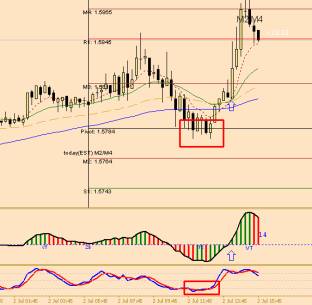
Here is my trade for today, second July'08. It is a easy trade. Follow the rule, be patience and money management. It is obvious at 4 hour chart, price is overbought but price is above 89 and 200 sma. So the trend is up at this stage. Now price retraces. At 1 hour chart, I saw price forms a double bottom and supported by 55 ema and 89 sma.
At 15 minute chart, price also forms a double bottom and found support at a central pivot point(CPP = 1.5784).
Sorry, I can not attach a graph. It is too big. I will later.
Enter a long trade at 1.5804 and close at 1.5855
Have a nice day
SRILOBA
Ignored
Now, you can see the attaches files.
- images002 is 1 hour char
- images004 is 15 minute char
Attached Images
Being a fxtrader is not easy. Ones must working hard.
What do you think about selling E/J, look at the charts attached.
There is an important fibo extension resistance at 168.50 on the 1H chart There is a 0.618 resistance in the bigger picture (4H), and a close below trendline and a round top could be possible. Also a descending triangle could be in place..
E/J could come back at least at the 21 EMA at 4 hs chart at 167.50.
My R1 pivot daily is at 168.13 but the weekly PP is at 167.99, so i prefer a close below this level.
What do you think??
Ignored
R:R looks good but I'll stay away because of NFP, perhaps I'll take some small trades tomorrow with 5 min Intraday if market shows me something.
I hope it helps.
What do you think about selling E/J, look at the charts attached.
There is an important fibo extension resistance at 168.50 on the 1H chart There is a 0.618 resistance in the bigger picture (4H), and a close below trendline and a round top could be possible. Also a descending triangle could be in place..
E/J could come back at least at the 21 EMA at 4 hs chart at 167.50.
My R1 pivot daily is at 168.13 but the weekly PP is at 167.99, so i prefer a close below this level.
What do you think??
Ignored
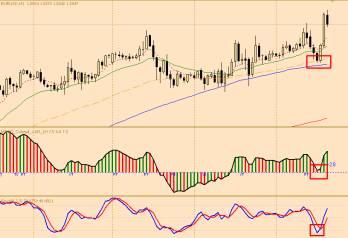
On the Daily Chart the price broke the resistance 167 marked by the red arrow and now it become support. There are two hammer (blue rectangular) that tested the bottom and the 21EMA. In conclusion the Daily looks bullish.
On the 4H Chart the price broke resistance 168 and now come back to test it. After a break out there is a pullack and a move away, which can be the case here. When the price reached the all-time high 169.44 could not be hold. It may probably test it again. But for the moment there is no signal on the MACD and the candle hasn't closed yet.
Entered long after a tail indicating a short trade failed and has been turned around by an engulfing strong bullish candle.
Enter at 1.5852
SL 1.5821
TP 1.5985
Will close 50% after 25pips gain and set remainder at BE
Edit 1
Close 50% after 25pips. Set remainder at BE and 45Trailing stop.
Edit 2
Price goes above 1.5900. Set remainder to 25 trailing stop
Edit 3
Close remainder closed by trailing stop at 1.5881
I would love to see your demo live trading to see how you did up to now. If 2 losses in a row is a problem then you should stop trading right now as 3 to 4 losses in a row is most definitely going to come as well. If you however only risk 2% of your capital per trade you can have 20 wrong deals in a row and still have 50% of your account. You should demotrade for at least 30-50 trades(done according to the system) and show a good deal of pips positive before going live.
again this morning i wonder is there any thing i really missed out.
I saw a TC pattern on the 04.00 candle,
A bullish engulfing candle or quasi tweezer bottom,
Entry at open of 08.00 candle @ 1.5759
SL below previous two candle low @ 1.5725
TP1 @ 1.5800
R:R 1:0.9
Was stopped out at SL
Kindly enlighten if i had entered too early?
I look forward to hearing from you.
Thanks a lot to Happy 68 and Scotty for there insight and may the pips be with you.
Thanks
Ignored
This was one of the few TC's that got stopped out. I mentioned it as well on the mp3 that I was lucky and only looked at the 8:-12:00 candle due to working matters therefore I entered later.
hi all
this is what i see in eu ,tommorow's NFP figures will show us which way.i think i'll be completely away in time of the news tommorow.there will both NFP and trichet speach at the same time and market can experice strange volatilities i think.
I did not take Phillip's trade today b/c on Interbank the candle closed at 5866 and resistance line was too close. I'm considering changing over to MIG, but it will be hard to switch to something unfamiliar. How is MIG?
Entered long after a tail indicating a short trade failed and has been turned around by an engulfing strong bullish candle.
Enter at 1.5852
SL 1.5821
TP 1.5985
Will close 50% after 25pips gain and set remainder at BE
Edit 1
Close 50% after 25pips. Set remainder at BE and 45Trailing stop.
Ignored
There was a TC on MIG terminal 4 hour early than metaquotes terminal,
although they have same candle open time,
there are some differences on the data,
so I took that TC.
Thanks for the explanation in mp3
Dhalsim
Success is the small sum of efforts, repeated day in and day out.