Hope this makes sense. Looks to me a theory taken to practical.
Ignored
It's always good to learn new things but please stay skeptical on ew theory, buddy. Very very few make any success here. If you're interested, I know only 1 ew'er which make any constant profit (so it seems from he's forum). He's name is fxsurfer. Goggle him and you'll find him over @ fxsurfers forum.
If you want to dig into something profitable, try AB=CD patterns so-called harmonic patterns. I still use them from time to time.
Ignored
I don't actually trade ew. It's just very interesting to see some theories we have read about coming to a "probable" reality.
I find very, very intresting. I focus on pattens but it's also lovely to have applications of stuff like this.
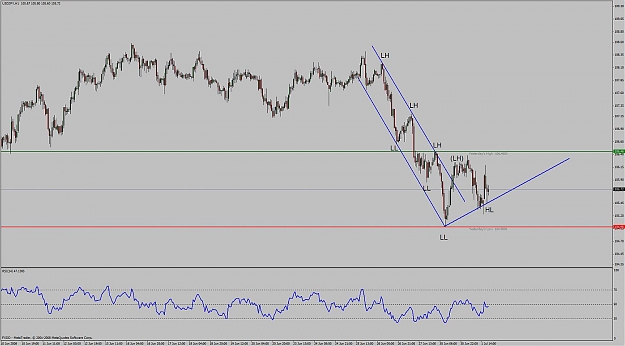
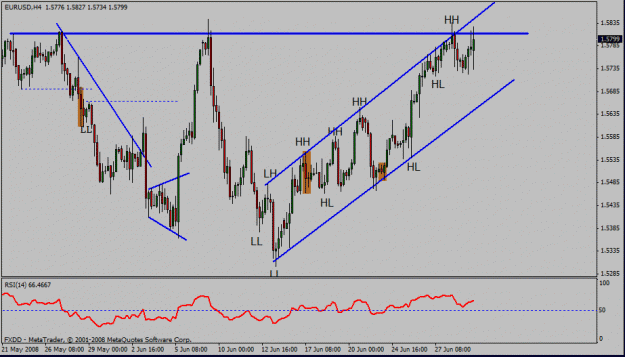
It looks "beautiful" to see these waves.
Also, it's so interesting to see that many people don't have the "ability" to see these waves.
I don't actually trade ew. It's just very interesting to see some theories we have read about coming to a "probable" reality.
I find very, very intresting. I focus on pattens but it's also lovely to have applications of stuff like this.
It looks "beautiful" to see these waves.
Also, it's so interesting to see that many people don't have the "ability" to see these waves.
Later mate.
Ignored
This is the last respond to ew in this thread from me; the thing with counting is, in hindsight, everything looks so obvious. If one count fails, you suddenly got 3-5 other setups to apply. There is absolutely no analyze method known to man-kind that can include every move the marked does. Ew "does". I strongly recommend to read Marber On Markets, some who have done technical anaylze for 50 years, including price-patterns, candlestick and so on. He also have a thing or two to say about elliot wavers as he calls them.
Btw, Elliot didn't make a penny from he's own work. The creater of it.
If you're really into it, make sure you learn it from someone who trades it profitable.
Ignored
As I said earlier,
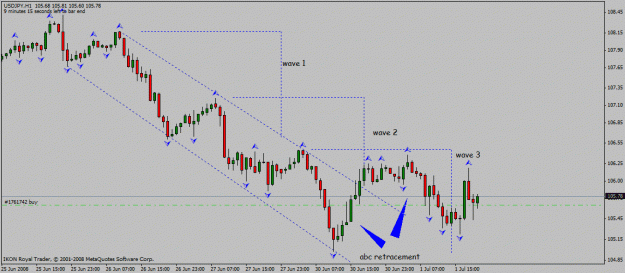
I don't trade ew. I just find it awesome how price moves in waves.
Hope I am making my self very clear on this.
I don't make any assumptions, place orders over them.
It's just like a post you came up with a few weeks ago talking about how some pairs move in waves.
This is the exact same thing. I don't trade it, just find interesting and "beautiful" how price can move in such pattern.
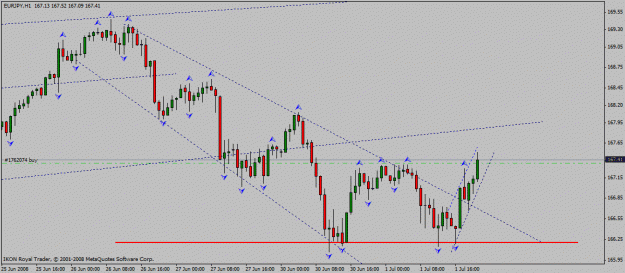
Hi Guy's
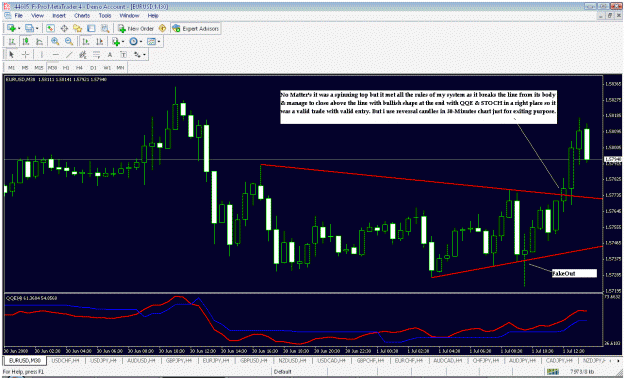
See this Euro/Usd Perfect breakUp & My Today's Stuff.
Ignored
hi Umairs,got a few q.s for you http://www.forexfactory.com/images/icons/icon5.gifon this post(yours) the candle which breaks the trend line is at best indecisive no?looks like a spinning top or mabye even an eve star??obviously you saw something as it was a good trade but isnt this against your method?(only a question not an attack of any kind http://www.forexfactory.com/images/icons/icon14.gif)
also do you ever consider early entries from the opposite trendline on bullish candles,e.g.the lower tl is on nice sup. and you get a nice pin bar,would you go long in anticipation of a break?
you have got me v interested in 30 min charts,they look good for these types of patterns.iv always used 1h with 15 mins (also 4h for trendline r/s pivots etc).what are your thought on these time frames??would like to here about the different tfs people play if anybody wants to post!??
finally,i have been experimenting recently using stoch and rsi divergence for a filter for entries.i have had good initial results ,do you ever use this method or have any experience with this.my only thoughts are that you miss a lot of trades.
thanx for your time,
jon.
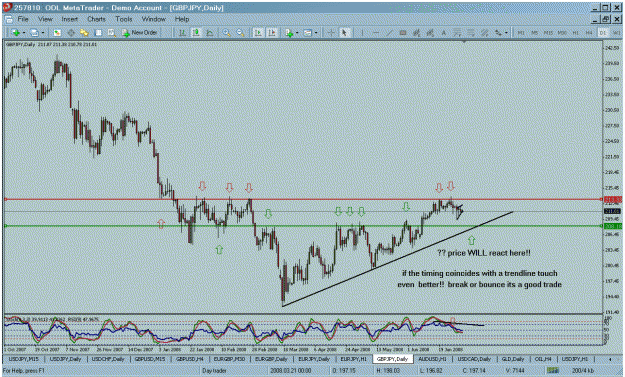
What is the best way to identify Horizontal Support and Resistance?
Ignored
hey rick,good q.
its important to keep your charts simple and only draw the most obvious lines on your charts,especially for us newbies.they are the ones everybody and his mam will be trading from!
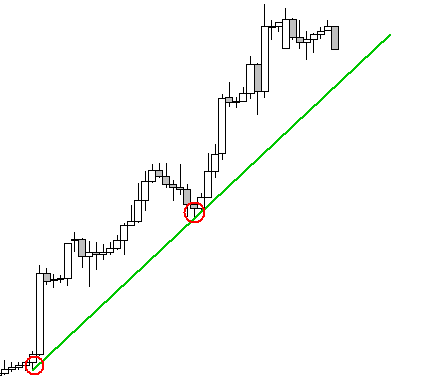
what i do to identify r/s/pivots is to zoom out on your charts ,starting from daily tfs min, and zoom out far enough to see enough significant data to see the BIG price patterns/trends.then simply draw your line where price has been reacting.the best s/r lines are the ones which price has broken then retested.these (if anyone doesnt know)are pivot lines(pivotal price levels)you can be sure the whole world and even his pet cat will be trading from those babys!! just to proove the point take this chart and zoom out on weekly tf
take your chart down to 4h and do the same(here you can tighten up your daily lines also)
drawing s/r does take a bit af practice and you need to get a feel for it but it comes easy enough.
general rule of thumb is the shorter tf the less reliable the line.and remember to trade the timeframe.
hope this helps
edit:check out Trader_Dantes "making money from trading"thread over on Trade2Win.v.good read for newbies.
Joined Feb 2008
|
Status: sucker for punishment
|2,444 Posts
and heres what im looking at now..
bullish divergence confirms false break (for now) but i also concider the line breached and therfore weakened.will watch to see if the div plays out on the indicator with little bullish price movement to look for a bearish break. candle yet to close.
continued rise above the overnite( gm+1 time)high would for me confirm the bullish sentiment (short term at least)
Well SL Was in Past just -40 Pip's & target for just +30-Pip's but now a days i have changed my strategy ...
My SL is -70 Pip's fixed & Target is +30 ---to---+60 Pip's depends on certain condition's.
visit post No# 2236 of this thread in this same page...with three posted screenshot's.
Also Visit this Post No # 561 of this thread... http://www.forexfactory.com/showthre...42#post1896842
GoodLuck!!!
Ignored
hi Umairs.this is quite a big sl,have you found this size necessary to stay in??you must have a good w?l ratio,could you post it?
i have also an initial target of 30 pips and if i think its going my way i then change sl to be and go for +50.in my experience(i only demo trade at the mo)a good clear pattern break will give you +50 more often then not,especially if they break on news!!but i have also found that -30 is enough for most pairs as the price tends to break with momentum and the initial move added to you sl will give you plenty or room??
p.s. sos for all the q.s im just catching up http://www.forexfactory.com/images/icons/icon14.gif
hi Umairs,got a few q.s for you on this post(yours) the candle which breaks the trend line is at best indecisive no?looks like a spinning top or mabye even an eve star??obviously you saw something as it was a good trade but isnt this against your method?(only a question not an attack of any kind )
also do you ever consider early entries from the opposite trendline on bullish candles,e.g.the lower tl is on nice sup. and you get a nice pin bar,would you go long in anticipation of a break?
you have got me v interested in 30 min charts,they look good for these types of patterns.iv always used 1h with 15 mins (also 4h for trendline r/s pivots etc).what are your thought on these time frames??would like to here about the different tfs people play if anybody wants to post!??
finally,i have been experimenting recently using stoch and rsi divergence for a filter for entries.i have had good initial results ,do you ever use this method or have any experience with this.my only thoughts are that you miss a lot of trades.
thanx for your time,
jon.
Ignored
Hi Jon
Thank's for your Patience
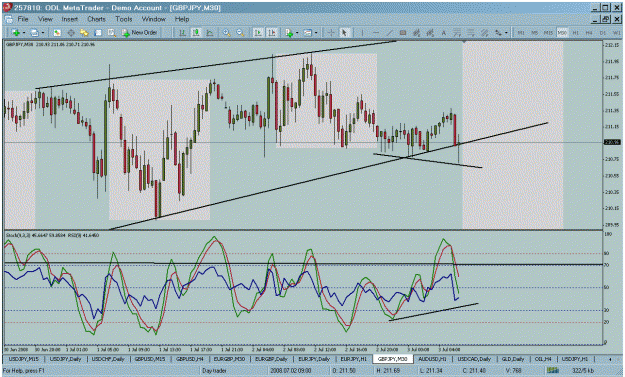
Well First of all remember reversal candles have a very strong & great impact on higher timeframes like 4-Hours and so on. Now this is a lower time frame(30-Minute). Well i am also a big fan of reversal candles but in lowertime frame like 30-Minute chart i only use them for exiting purpose. I close my positions when i saw a formation of any reversal candles in lowertime frames like 30-minutes. Now see this screenshot again all conditions are clearly met as candle breaks the upperline with its body & manage to formed a bullish shape at the end also. So i entered in a next candle & it was my winning trade also.Now see the posted screenshot No#1
--Rules Of My System For 30-Minute Time frame!!!
Now i would like to post the rules of my system with detail here with screenshot's So you guy's may not feel any problem again...
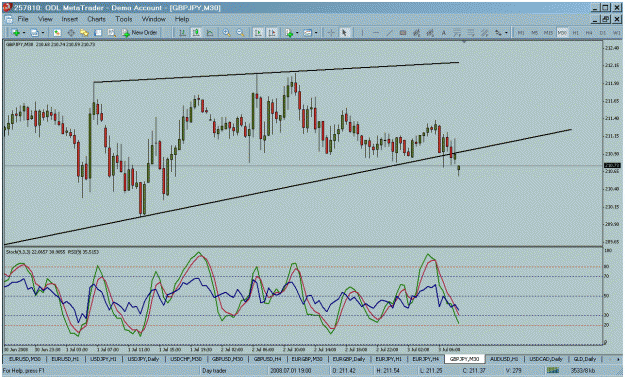
1) For example for drawing a lower line of trendline in 30-minute chart Just find three or atleast two points in which market make it's low & than retraces back atlest for two/three bullish candles, now you have to judge yourself that these point's or lows are making sence or not to draw valid lines. Confidence on yourself & draw lower line. Now see posted screenshot's No#2 & No#3 ... See yourself what happened after you draw a valid lower line of trendline in screenshot No# 3 Jon , jupitier ,Bksujal & Guy's. First see yourfelf jon the candle which breaks the lowerline of trendline formed a spinning top shape in a 30-minute chart. Yes the same shape in my screenshot No#1 you will find and also you have questioned about. So see candle breaks it from middle(Body) & it formed a bearish shape at the end. It was a 30-Minute chart so you may enters in a next candle for short Also see yourself in screenshot No#3 that it also dropped & vice-versa for long.
That's all about the rules how i go long or short in lowertime frame(30-minute)...I,ll post the more detail in my next post with screenshot. Umair (I got the other screenshot's from another very good educational site)
hi Umair,
you have got me v interested in 30 min charts,they look good for these types of patterns.iv always used 1h with 15 mins (also 4h for trendline r/s pivots etc).what are your thought on these time frames??would like to here about the different tfs people play if anybody wants to post!??
finally,i have been experimenting recently using stoch and rsi divergence for a filter for entries.i have had good initial results ,do you ever use this method or have any experience with this.my only thoughts are that you miss a lot of trades.
thanx for your time,
jon.
Ignored
Well My this strategy is also workes very good with 5-Minutes , 15-Minutes & Hourly chart's. Though i have no experience with these tf's on live but i have back tested tham lot of times, & seems working very well on these tf's also
As you know in enter in a next candle in 30-minute chart with all the other conditions are in right place but in 4-Hour's & on word tf's. I enters excat after the break inthe same candle. As you they are higher tf's but i think trendlines work very best & effective in lower tf's from 5-minutes to 30-minutes but in higher tf's like 4-hours & onword S/R Lines work very best & effective with high impact. But you can use TL, & S/R Lines at the same time at any tf, & they will also work for you but only if you draw them valid.
& About RSI & STOCH divergence ...
Yes i use the combination of both these indicators lot of time for my entry but only in 4-hour tf. But only if reversal candles are in right place to go long or short with both these indicator's.
hi Umairs.this is quite a big sl,have you found this size necessary to stay in??you must have a good w?l ratio,could you post it?
i have also an initial target of 30 pips and if i think its going my way i then change sl to be and go for +50.in my experience(i only demo trade at the mo)a good clear pattern break will give you +50 more often then not,especially if they break on news!!but i have also found that -30 is enough for most pairs as the price tends to break with momentum and the initial move added to you sl will give you plenty or room??
p.s. sos for all the q.s im just catching up http://www.forexfactory.com/images/icons/icon14.gif
Ignored
Yes in 4-Hour chart in which in enters after the break of S/R Line my SL is -70 Pip's where as in lower tf my SL is -40 Pip's in non jpy related pairs and -70 Pip's in GPY related pair's. Yes now my winning ratio is very good than as compared to past. I think my this sl strategy works very good with my trading style and strategy.