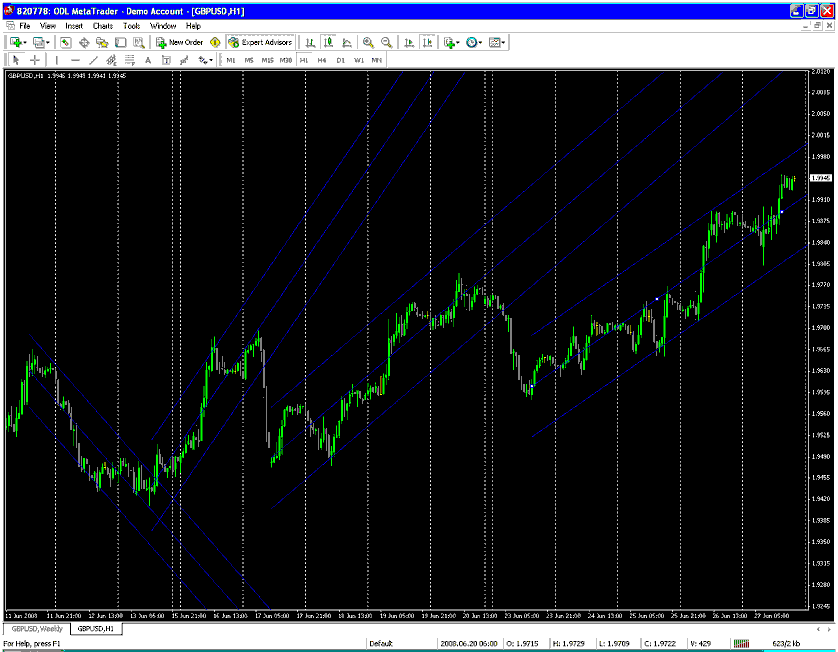
You want to trade with the fib levels in the same manner, the price channel just gives you a visual aid in the pairs direction and confirms your trades when you see the channel broken from as well, since it will indicate a directional change or break from the current trending patterns. A break of the channel is the same as with a fib level...a candle opening outside of it.
Ignored
So i think Bo want to point out that price have broke the channel, so a new trend might have show up, it might be a major trend continuity without to many correction. But let`s bet we might retest some lower level befor it`s shoot up! Dont forget Goodthings stats!
Attached Image (click to enlarge)
Harmonics and Pitchfork using korHarmonics from TradingArsenal
So i think Bo want to point out that price have broke the channel, so a new trend might have show up, it might be a major trend continuity without to many correction. But let`s bet we might retest some lower level befor it`s shoot up! Dont forget Goodthings stats! Attachment
Ignored
From the 1 hour I would only go back as far as the last low we made this week, that way we can see if we get retracement from fridays move a break of the fridays Intraday levels will also be a break of the current trending pattern and signal some deeper correction into this move up from this week. And yes if you pull an LRC from last fridays through this last monday once price broke the top level from that is was an indication that we could be seeing it reverse long so you move your LRC up now and begin pulling it up from Mondays low to the last candle of tuesday and leave until price breaks from that, once it does you only pull the LRC up to the last candle of the day that price broken from it and if it continues to break the top resistance line the strength of the move signals continuation. Channels work very siilar to trend lines. They are not perfect but they do offer some assistance.
I have a question on the linnear regression....Is this right its very similar to fibbs...You can place a linnear regression channel from a high and a low like we place our intraday fibb. Or place it from the bigger high and low just like we place are longer term fibbs.
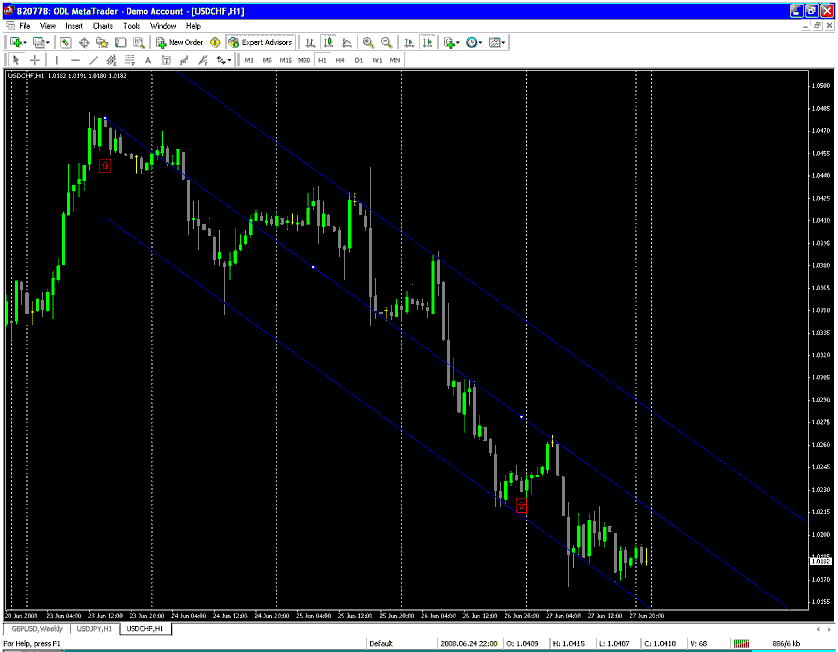
And what i have to do is place the bigger one with the linnear regression channel since the real purpose is to see when the most recent trend is and when it reverses, also if a bigger one reverses it can be prof that price is respoding to a larger timeframe fibb, so in reality what I am measuring with the linnear regression channel Is from A to B or B to C looking at it from a larger time frame since our trend in the 1 hour chart is based on the larger movements. I know it would not be good to place it from the the low and the high of the previous day since it would be to vertical and wont be as powerful and i could get cought in fake reversal.In my picture below are examples of linnear regression channels from a low to a high and this are also spots that i would consider placing my swing fibb if I was in a trade. The last one is the one that i believe is right and thats the one that shows me the current trend and i would keep on pulling to the highest and that would show me the trend is still strong in that direction though is my last regression channel if it brakes to the bearish side it would be a good probability of a reversal because of the angle it has since its powerful.You can also measure the movements down but they are to vertical and had no continuation to is since price reacted the bigger fibb swings. So what i really believe is I have to measure with the linnear regression channel is the last leg in price. Let me know if this is right or I am thinking to much and I am wrong.
I have a question on the linnear regression....Is this right its very similar to fibbs...You can place a linnear regression channel from a high and a low like we place our intraday fibb. Or place it from the bigger high and low just like we place are longer term fibbs.
And what i have to do is place the bigger one with the linnear regression channel since the real purpose is to see when the most recent trend is and when it reverses, also if a bigger one reverses it can be prof that price is respoding to a larger timeframe fibb, so in reality what I am measuring with the linnear regression channel Is from A to B or B to C looking at it from a larger time frame since our trend in the 1 hour chart is based on the larger movements. I know it would not be good to place it from the the low and the high of the previous day since it would be to vertical and wont be as powerful and i could get cought in fake reversal.In my picture below are examples of linnear regression channels from a low to a high and this are also spots that i would consider placing my swing fibb if I was in a trade. The last one is the one that i believe is right and thats the one that shows me the current trend and i would keep on pulling to the highest and that would show me the trend is still strong in that direction though is my last regression channel if it brakes to the bearish side it would be a good probability of a reversal because of the angle it has since its powerful.You can also measure the movements down but they are to vertical and had no continuation to is since price reacted the bigger fibb swings. So what i really believe is I have to measure with the linnear regression channel is the last leg in price. Let me know if this is right or I am thinking to much and I am wrong.
if we want to find a indicator which is very similar to the fib, the fib fans is a very good candidate. it can provide very good support and resistance, use it with fib .
Ignored
Ive used them as well but a good trend line will get the same job accomplished.
They all look ok to me, just the AUD I dont keep a chart on and it looks like thats more of what you would get from a 4hour chart once you start getting that long with it, for now just go from the low point of last week as an anchor point. And yes the AUD looks like it has been trending in that channel that long.
|
Joined Aug 2006
|
Status: AKA DareDevil
|527 Posts
I found this chart by Goodthings with his retracement probabilities on the intraday. I don`t know if these figure are true, or still hold the road but if they are it is solid gold.
Attached Image
And the post that come with it::: Here is the daily fib retracements for the gbpusd and the percentage of times it retraces to these levels. These percentages are based on the high of the low for the day which now it looks like for today the high is 2.0378 and the low is 2.0281. My daily candle does not end until 6pm eastern time USA. These probabilites have a 7 pip tolerance. For instance today if highs and lows hold it has retraced to 2.0347 and the 38.2 fib is 2.0341. I call that a hit but also wait to see how the next day trades and see if it goes lower to the 50 fib or 61.8 fib
Harmonics and Pitchfork using korHarmonics from TradingArsenal
|
Joined Aug 2006
|
Status: AKA DareDevil
|527 Posts
I won`t pull up any charts.. Earlier, Tuesday target had happen at 9966, and then friday bottom at 9800 to 9966 had it`s 38.2 retracement at 9899 just happened, i took long already at the first bounce at 9908 and my target is 2017, was i too fast? Should i have waited for candle to close over the 38.2?
Harmonics and Pitchfork using korHarmonics from TradingArsenal
I won`t pull up any charts.. Earlier, Tuesday target had happen at 9966, and then friday bottom at 9800 to 9966 had it`s 38.2 retracement at 9899 just happen, i took long already at the first bounce at 9908 and my target is 2017, was i too fast? Sould i have waited for candle to close over the 38.2?
Ignored
Its more risky to trade off the levels themselves, but its not wrong. Entering from the levels can get you in at better prices as long as price does bounce or get rejected from those levels, the problem is if price action doesnt agree and by that I mean in the next consecutive candles do they continue in the bounce or rejection or does price continue to make lower lows or higher highs from those points. Entering off the levels, just pay attention to price action from this point as new candles are formed and completed. A break from The previous Intraday short level would not be a good sign either.
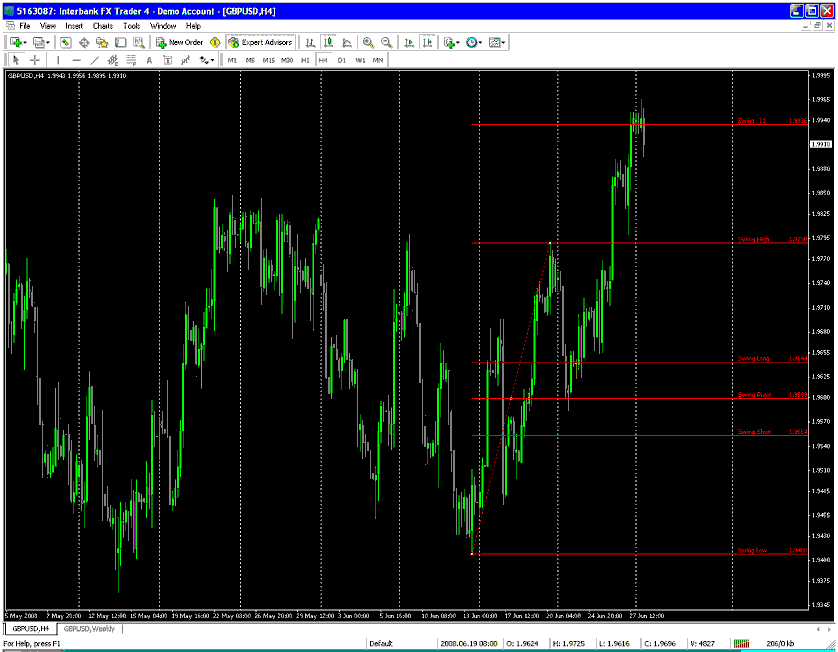
Bo does this swing have to anything with it stopping it. I have been Looking at this swing since Friday and have been afraid of taking brakes of highs. Let me know what you think and what Importance you give to it...
Its more risky to trade off the levels themselves, but its not wrong. Entering from the levels can get you in at better prices as long as price does bounce or get rejected from those levels, the problem is if price action doesnt agree and by that I mean in the next consecutive candles do they continue in the bounce or rejection or does price continue to make lower lows or higher highs from those points. Entering off the levels, just pay attention to price action from this point as new candles are formed and completed.
Ignored
Obviously, candle have just close over, momentum is still down but the support is holding. I placed my stop 10 pips under the 68.2 at 9855. Time for a shower.
Harmonics and Pitchfork using korHarmonics from TradingArsenal
Bo does this swing have to anything with it stopping it. I have been Looking at this swing since Friday and have been afraid of taking brakes of highs. Let me know what you think and what Importance you give to it...
Once the target range of that has been met it doesnt serve any purpose. New waveforms have unfolded and the market has changed in the 1 hour timeframe from those since then.
Obviously, candle have just close over, momentum is still down but the support is holding. I placed my stop 10 pips under the 68.2 at 9855. Time for a shower.
Ignored
As long as support contiues to hold from fridays Intraday youll be ok. For fridays Intraday I would use the low of friday to the high of today, since this is the first true retracement since the low on friday.
As long as support contiues to hold from fridays Intraday youll be ok. For fridays Intraday I would use the low of friday to the high of today, since this is the first true retracement since the low on friday.
Ignored
Thanks for reading my mind. I wanted to ask..
Harmonics and Pitchfork using korHarmonics from TradingArsenal
 Fibonacci Trading with Bobokus