• Home
  • Forums
  • Trades
  • News
  • Calendar
  • Market
  • Brokers
  • Login
  • Join
  • User/Email: Password:
  • 10:00pm
Menu
  • Forums
  • Trades
  • News
  • Calendar
  • Market
  • Brokers
  • Login
  • Join
  • 10:00pm
Sister Sites
  • Metals Mine
  • Energy EXCH
  • Crypto Craft

Options

Bookmark Thread

First Page First Unread Last Page Last Post

Print Thread

Similar Threads

Drawing Correct Trendlines 58 replies

Drawing Gann Grid in mt4, the correct way 3 replies

Drawing correct S/R and pivot 8 replies

Drawing Objects vs Drawing lines 1 reply

Drawing support and resistance lines 4 replies

  • Trading Discussion
  • /
  • Reply to Thread
  • Subscribe
  • 1,537
Attachments: Drawing correct resistance and support-lines
Exit Attachments
Tags: Drawing correct resistance and support-lines
Cancel

Drawing correct resistance and support-lines

  • Last Post
  •  
  • 1 109110Page 111112113 134
  • 1 Page 111 134
  •  
  • Trend Trading | Brokerage Account XXXX22
  • Expand
  • Retract
  • Last Sync: Sep 13, 2016
  • Overview

  • Trade Report

  • Trade Graph

  • Trade List

Sep 13, 2016
Last Sync: Sep 13, 2016
  • Overview

  • Trade Report

  • Trade Graph

  • Trade List

  • Period: All History

Sep 13, 2016
Last Sync: Sep 13, 2016
  • Overview

  • Trade Report

  • Trade Graph

  • Trade List

Sep 13, 2016
Last Sync: Sep 13, 2016
  • Overview

  • Trade Report

  • Trade Graph

  • Trade List

Sep 13, 2016
Last Sync: Sep 13, 2016
  • All History
  • Today
  • Yesterday
  • This Week
  • This Month
  • This Year
  • Last Week
  • Last Month
  • Last Year
to
No trading activity in this period.
  • Post #2,201
  • Quote
  • Jun 26, 2008 8:26am Jun 26, 2008 8:26am
  •  hilmiy2k
  • | Joined Dec 2007 | Status: "I trade Out Of The Chart " | 142 Posts
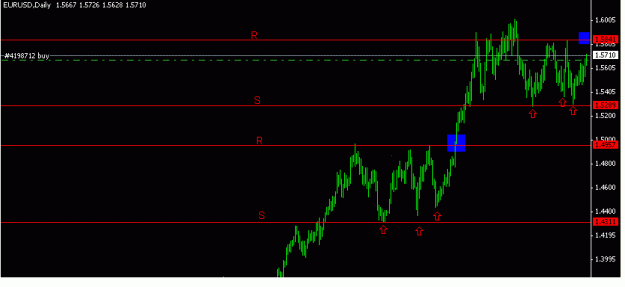
is this tripple bottom which would take us to 1.6 again(break out in blue colour)? see the history of price patern(tripple bottom) in my attached grapf which used to break 1.5 record .what do you think traders?
Attached Image (click to enlarge)
Click to Enlarge

Name: TRPPLE BTTOM.GIF
Size: 8 KB
 
 
  • Post #2,202
  • Quote
  • Jun 26, 2008 12:51pm Jun 26, 2008 12:51pm
  •  jupiter_peak
  • Joined Apr 2008 | Status: Controlled Trading. | 1,161 Posts
Hey guys,

I had to be out for today in the morning and got back to my sttion just now.

I knoe most of you are thinking: "here comes that Jupiter with those many daily charts..."

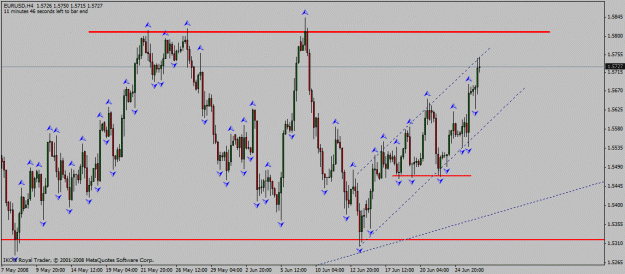
But here I come with EURUSD channeling up towards Resistance @ 1.5810.

So 1.5810, like any other S/Rs, is a critical line if you know what I mean.
Attached Image(s) (click to enlarge)
Click to Enlarge

Name: eur_usd_h4_26_06_2008_channel_up.gif
Size: 23 KB
Click to Enlarge

Name: eur_usd_d1_26_06_2008_channel_up.gif
Size: 18 KB
 
 
  • Post #2,203
  • Quote
  • Jun 26, 2008 12:58pm Jun 26, 2008 12:58pm
  •  silverheat
  • Joined May 2008 | Status: dynamic | 2,412 Posts
Hi Everybody,

i wanna show u this chart, because its my first one with more than 50 pips

and also i want to ask if i should stay in until the LTL, and if my S/L is to tight?

as i write it broke throug the purple lines, which was resistance i think, 90 pips so far

regards
Attached Image (click to enlarge)
Click to Enlarge

Name: Unbenannt.png
Size: 31 KB
Invincibility lies in the defence, the possibility of victory in the attack
 
 
  • Post #2,204
  • Quote
  • Jun 26, 2008 1:03pm Jun 26, 2008 1:03pm
  •  jupiter_peak
  • Joined Apr 2008 | Status: Controlled Trading. | 1,161 Posts
Opposite to EU, UC is channeling down towards the LTL of the triangle seen on daily.

That LTL of the triangle is also a critical line. A very good one indeed.

Cheers.
Attached Image(s) (click to enlarge)
Click to Enlarge

Name: usd_chf_h4_26_06_2008_channel_down.gif
Size: 23 KB
Click to Enlarge

Name: usd_chf_d1_26_06_2008_triangle.gif
Size: 18 KB
 
 
  • Post #2,205
  • Quote
  • Jun 26, 2008 1:08pm Jun 26, 2008 1:08pm
  •  jupiter_peak
  • Joined Apr 2008 | Status: Controlled Trading. | 1,161 Posts
Quoting silverheat
Disliked
Hi Everybody,

i wanna show u this chart, because its my first one with more than 50 pips

and also i want to ask if i should stay in until the LTL, and if my S/L is to tight?

as i write it broke throug the purple lines, which was resistance i think, 90 pips so far

regards
Ignored

Congrats Silver!!

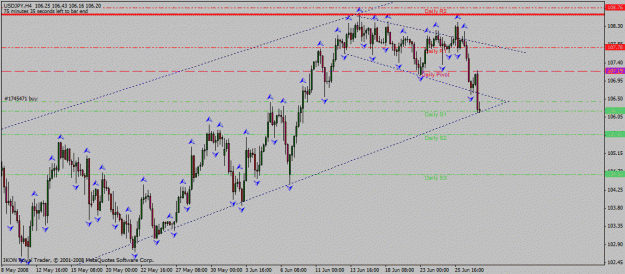
Here comes UJ

Price channeling down. We had a fake break yesterday (news) that actuallythe literature tells us that is an excellent trend continuation sign.

Price hit a very strong resistance recently(@ 108.60) and is channelling down towards the LTL of an ascending channel.

That LTL of the ascending channel is a critical line. At least for me.
Attached Image(s) (click to enlarge)
Click to Enlarge

Name: usd_jpy_h4_26_06_2008_channel_down.gif
Size: 21 KB
Click to Enlarge

Name: usd_jpy_d1_26_06_2008_channel_up.gif
Size: 18 KB
 
 
  • Post #2,206
  • Quote
  • Jun 26, 2008 1:16pm Jun 26, 2008 1:16pm
  •  jupiter_peak
  • Joined Apr 2008 | Status: Controlled Trading. | 1,161 Posts
Cable made a great break today!1 I missed it.. damn...

Price is channeling upwards and broke res. @ 1.9820.

Price recently "hit" the LTL of a channel observed on weekly and could ( I SAY COULD!!!) be heading up for a while.

I rather not predict the future, because it's simply umpredictable.

Here are my charts for Cable.

Best.
Attached Image(s) (click to enlarge)
Click to Enlarge

Name: gbp_usd_d1_26_06_2008_channel_down_break.gif
Size: 21 KB
Click to Enlarge

Name: gbp_usd_h4_26_06_2008_channel_up_break.gif
Size: 24 KB
Click to Enlarge

Name: gbp_usd_w1_26_06_2008_channel_up.gif
Size: 21 KB
 
 
  • Post #2,207
  • Quote
  • Jun 26, 2008 1:22pm Jun 26, 2008 1:22pm
  •  jupiter_peak
  • Joined Apr 2008 | Status: Controlled Trading. | 1,161 Posts
USDCAD is channeling down towards resistance @ 1.0085.

Good (critical line) to open positions. (at least for me)

Later..
Attached Image(s) (click to enlarge)
Click to Enlarge

Name: usd_cad_d1_26_06_2008_triangle.gif
Size: 19 KB
Click to Enlarge

Name: usd_cad_h4_26_06_2008_channel_down_res..gif
Size: 20 KB
 
 
  • Post #2,208
  • Quote
  • Jun 26, 2008 1:46pm Jun 26, 2008 1:46pm
  •  Umairs2004
  • | Joined Oct 2007 | Status: Technical Trader | 765 Posts
Wow Guy's a sudden great brearish move is there by G/J For almost +170 Pip's. Anyway's i was very much sure about 213.27 as a strong resistance level now see after breaking this very much strong resistance level G/J Moved up for almost +63 Pip's & where as i manage to lock +30 Pip's today. Now it was a very strange and strong bearish move by G/J... See the screenshot of G/J Before showing bearish move making it's high...
Attached Image (click to enlarge)
Click to Enlarge

Name: gbd.jpy22.gif
Size: 36 KB
 
 
  • Post #2,209
  • Quote
  • Jun 26, 2008 2:01pm Jun 26, 2008 2:01pm
  •  jupiter_peak
  • Joined Apr 2008 | Status: Controlled Trading. | 1,161 Posts
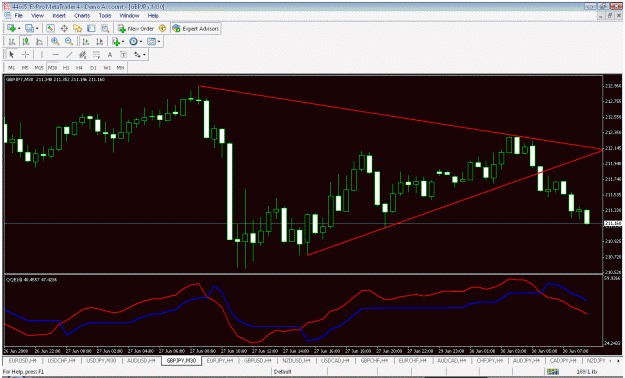
This is what I see for GBPJPY.

Price is channeling upwards but is facing resistance @ +- 213.50.

My guess, a wild one, is that it could start chenneling downwards towards that wider LTL of the ascending channel and hit back up.

But this, of course, just is my wild guess. I rather not assume it but make a decision over critical lines.

Cheers.
Attached Image(s) (click to enlarge)
Click to Enlarge

Name: gbp_jpy_d1_26_06_2008_channel_up.gif
Size: 19 KB
Click to Enlarge

Name: gbp_jpy_h4_26_06_2008_channel_up_break_down.gif
Size: 18 KB
 
 
  • Post #2,210
  • Quote
  • Jun 26, 2008 3:35pm Jun 26, 2008 3:35pm
  •  silverheat
  • Joined May 2008 | Status: dynamic | 2,412 Posts
Quoting jupiter_peak
Disliked
Congrats Silver!!

Here comes UJ

Price channeling down. We had a fake break yesterday (news) that actuallythe literature tells us that is an excellent trend continuation sign.

Price hit a very strong resistance recently(@ 108.60) and is channelling down towards the LTL of an ascending channel.

That LTL of the ascending channel is a critical line. At least for me.
Ignored
Thanks Jupiter,

btw, i have to say your charts always add "something" to my own view, so thanks for posting them, i hope u dont mind me stealing some of your TLs
Invincibility lies in the defence, the possibility of victory in the attack
 
 
  • Post #2,211
  • Quote
  • Jun 26, 2008 10:06pm Jun 26, 2008 10:06pm
  •  jupiter_peak
  • Joined Apr 2008 | Status: Controlled Trading. | 1,161 Posts
Quoting silverheat
Disliked
Thanks Jupiter,

btw, i have to say your charts always add "something" to my own view, so thanks for posting them, i hope u dont mind me stealing some of your TLs
Ignored

Not at all.Please borrow them at will. I just hope they are right or at least that they make sense.

So far so good.


  • Post #2,212
  • Quote
  • Jun 27, 2008 7:49am Jun 27, 2008 7:49am
  •  jupiter_peak
  • Joined Apr 2008 | Status: Controlled Trading. | 1,161 Posts
Look out for UJ...
Attached Image (click to enlarge)
Click to Enlarge

Name: usd_jpy_h4_27_06_2008_channel_down_testing.gif
Size: 24 KB
 
 
  • Post #2,213
  • Quote
  • Jun 27, 2008 7:56am Jun 27, 2008 7:56am
  •  jupiter_peak
  • Joined Apr 2008 | Status: Controlled Trading. | 1,161 Posts
Triangle break on USDCHF.
Attached Image (click to enlarge)
Click to Enlarge

Name: usd_chf_h4_27_06_2008_channel_down_break.gif
Size: 24 KB
 
 
  • Post #2,214
  • Quote
  • Jun 27, 2008 8:01am Jun 27, 2008 8:01am
  •  jupiter_peak
  • Joined Apr 2008 | Status: Controlled Trading. | 1,161 Posts
Support break on USDCAD.
Attached Image (click to enlarge)
Click to Enlarge

Name: usd_cad_h4_27_06_2008_channel_down_break.gif
Size: 17 KB
 
 
  • Post #2,215
  • Quote
  • Jun 27, 2008 1:34pm Jun 27, 2008 1:34pm
  •  jupiter_peak
  • Joined Apr 2008 | Status: Controlled Trading. | 1,161 Posts
Bulls are fighting bears tuff!!

Who's going to win?

Bears are looking strong now...

Maybe a break is under way!!!
Attached Image (click to enlarge)
Click to Enlarge

Name: usd_jpy_h4_27_06_2008_channel_down_break.gif
Size: 19 KB
 
 
  • Post #2,216
  • Quote
  • Jun 30, 2008 1:44am Jun 30, 2008 1:44am
  •  Umairs2004
  • | Joined Oct 2007 | Status: Technical Trader | 765 Posts
Hi Guy's i got the good early breakout of Gbd/Jpy for +30 Pip's...See the screenshot.
Attached Image (click to enlarge)
Click to Enlarge

Name: gbd.jpy3.gif
Size: 36 KB
 
 
  • Post #2,217
  • Quote
  • Jun 30, 2008 2:13am Jun 30, 2008 2:13am
  •  Umairs2004
  • | Joined Oct 2007 | Status: Technical Trader | 765 Posts
WoW See the same breakout with Usd/Jpy Also. But Missed this One. So far drop's for Almost for +56 Pip's
Attached Image (click to enlarge)
Click to Enlarge

Name: ujk.gif
Size: 35 KB
 
 
  • Post #2,218
  • Quote
  • Jun 30, 2008 2:19am Jun 30, 2008 2:19am
  •  Umairs2004
  • | Joined Oct 2007 | Status: Technical Trader | 765 Posts

But forget to mention about E/J. See it drop's for almost +100 Pip's after a solid breakdown, WoW Seems another breakout day in Lower Time frames.

Attached Image (click to enlarge)
Click to Enlarge

Name: ejjk.gif
Size: 36 KB
 
 
  • Post #2,219
  • Quote
  • Jun 30, 2008 3:49am Jun 30, 2008 3:49am
  •  bksujal
  • | Joined Jun 2007 | Status: candlestick trader | 991 Posts
so you prefer 2 points for a trendline umair? Unfortunately my analysis would not have got me those pips as I believe in 3 or more points for trading.
 
 
  • Post #2,220
  • Quote
  • Jun 30, 2008 3:52am Jun 30, 2008 3:52am
  •  jupiter_peak
  • Joined Apr 2008 | Status: Controlled Trading. | 1,161 Posts
Quoting Umairs2004
Disliked

But forget to mention about E/J. See it drop's for almost +100 Pip's after a solid breakdown, WoW Seems another breakout day in Lower Time frames.

Ignored
I am in south UJ and EJ.


+90 for UJ and + 101 for EJ so far...

yahoooo!!
 
 
  • Trading Discussion
  • /
  • Drawing correct resistance and support-lines
  • Reply to Thread
    • 1 109110Page 111112113 134
    • 1 Page 111 134
0 traders viewing now
  • More
Top of Page
  • Facebook
  • Twitter
About FF
  • Mission
  • Products
  • User Guide
  • Media Kit
  • Blog
  • Contact
FF Products
  • Forums
  • Trades
  • Calendar
  • News
  • Market
  • Brokers
  • Trade Explorer
FF Website
  • Homepage
  • Search
  • Members
  • Report a Bug
Follow FF
  • Facebook
  • Twitter

FF Sister Sites:

  • Metals Mine
  • Energy EXCH
  • Crypto Craft

Forex Factory® is a brand of Fair Economy, Inc.

Terms of Service / ©2023