You're following the trend. Just be aware of possible resistance on e/u. I'm still bullish on this pair.
Ignored
I exited the E/U and the U/C with a loss. They do not have the momentum to continue the move in my favor. Do you think Mondays are days that momentum is low, waiting for the USD to open?
Hey i would like to know if you can show me an example of how you start analyzing a currency with several picuteres. For example lets say you do the gbp/usd can you show me how you would start analyzing it from start from the weekly chart or from the chart you start with and bring it down to the smallest time frame you trade. I whant to see your though behind and how you would place them. This would help me greatly thanks.
Hi Dcb :-)
Are you trading just the pairs without any outgoing fundaments on the day of trading?
Thank You
Ignored
Hi Daniel,
I trade by technical movement. I do wait for news to come out knowing the news will affect the price movement. I believe the technicals are a picture of how the market is reacting to many things including fundamentals.
I exited the E/U and the U/C with a loss. They do not have the momentum to continue the move in my favor. Do you think Mondays are days that momentum is low, waiting for the USD to open?
Ignored
Hey DCB,
I truly don't believe it has to do with momentum. Well, EU and UC go opposite. EU is facing strong resistance. Since EU is undecided if it breaks or not, most probably because of the upcoming news, both of the pairs are under stagnation.
Hey i would like to know if you can show me an example of how you start analyzing a currency with several picuteres. For example lets say you do the gbp/usd can you show me how you would start analyzing it from start from the weekly chart or from the chart you start with and bring it down to the smallest time frame you trade. I whant to see your though behind and how you would place them. This would help me greatly thanks.
Ignored
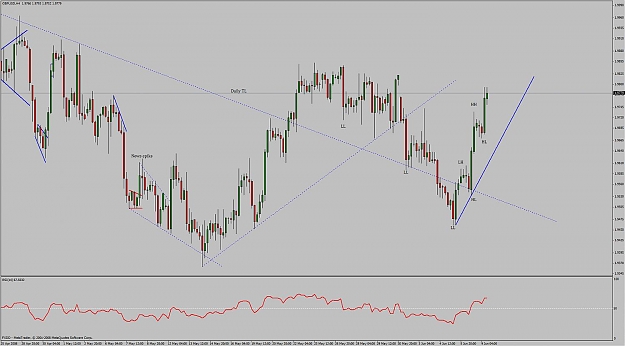
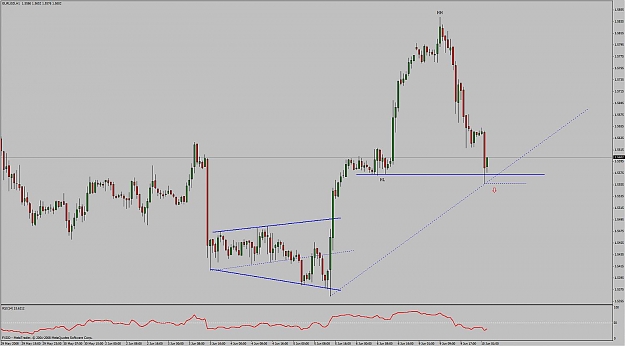
First objective is to find out which side you want to participate with (bulls or bears). So for me as an day-trader, I use daily chart as my highest TF. I.e 1h, 4h and daily. Thats enough for me. But it doesn't hurt to have a peak on weekly/monthly too, I just don't include it when day-trading. It doesn't help your short position based on 1h chart much that the monthly trend is overall down. Price can still move 100's of pips up before going down to its main trend. Don't forget. I see that many have problems defining trend and how to follow it.
Since the close of 06.05.08 you should be looking for long positions (only). Price closed above broken TL. So with the info from daily chart, we are on the scout for long positions.
4h chart; Price took out LH and confirmed HL which now tells us that bulls are in favor. Trying to gouge the best entry we take 1h. Would you know, price just formed a bullish flag. Bingo. High-probability trade. Your best friend.
So, waiting almost 3 days and all that "trouble" only for 1 trade ? Welcome to the reality of trading. Good trades doesn't happen (for me) every day. This is how you built your confidence up. By confirming the trend. Analyzing the trend. Measuring and taking the health of your trend.
This is how your brain works;
If you fight another person, the probability for doing it twice is in favor.
If you kick your cat once, the probability for doing it twice is in favor.
If you break your trading-rules, the probability for doing it a second time is in favor.
In other words, human minds make habits/acceptance damn fast. If you make a losing trade, the probability for doing it twice (in a row) is increased.
So you need to learn how to follow the trend and never counter-trade it ! If you're trying to catch tops/making counter-trend trades, you will most likely do it again. A very good recipe for decreasing your account. So to increase your account, simply do the opposite.
Am I looking for position right now on cable ? No. See how price is getting close to resistance and TL. I'll let the big bulls and bear fight to death around that area. Then I'll come back and have a look on what side I should join. Consider me as an sneaky bastard !
Joined Apr 2008
|
Status: Controlled Trading.
|1,161 Posts
Hey guys,
I have been following this pair very carefully lately and indeed it has been very profitable to me at least.
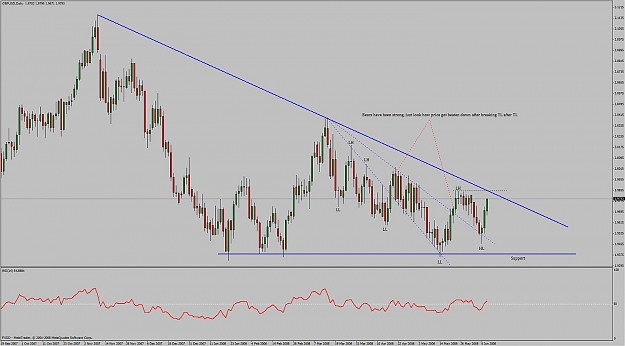
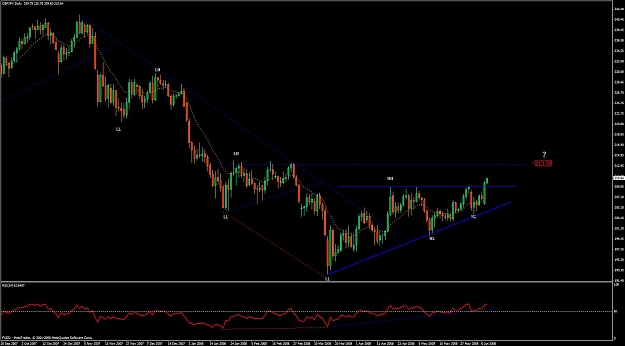
Monthly - Descending channel. Very solid.
Weekly - Descending channel. Also very solid.
Daily - Symmetrical Triangle.
H4 - Inside the triangle currently upwards towards daily's triangle UTL.
Triangles are very safe to trade inside them. However, the desecending channel on weekly was touched on Nov. 7, 2007 and began its way back up towards the UTL.
Thereore, I am not sure as of now if price will be bouncing inside the triangle until it hits the UTL for a safe bounce back downwards or if it will break the triangles UTL.
I have been following this pair very carefully lately and indeed it has been very profitable to me at least.
Monthly - Descending channel. Very solid.
Weekly - Descending channel. Also very solid.
Daily - Symmetrical Triangle.
H4 - Inside the triangle currently upwards towards daily's triangle UTL.
Triangles are very safe to trade inside them. However, the desecending channel on weekly was touched on Nov. 7, 2007 and began its way back up towards the UTL.
Thereore, I am not sure as of now if price will be bouncing inside the triangle until it hits the UTL for a safe bounce back downwards or if it will break the triangles UTL.
What do you guys think?
Ignored
I'm biased for more upside as long as price is trading above TL and it wouldn't be bad for bulls if we closed above recent high, around .0200 area. TL is "drawable" from 1h till daily chart. I don't have any clear pattern right now.
I'm biased for more upside as long as price is trading above TL and it wouldn't be bad for bulls if we closed above recent high, around .0200 area. TL is "drawable" from 1h till daily chart. I don't have any clear pattern right now.
Ignored
I am till long too. However, in a couple of days or so (even less)we should reach UTL.
I am curently profiting from bounces ofo of that upside channel.
I opened a SHORT position below pivot today on E/U.
I know we were not supposed to open positions contrary to the trend, but I couldn't resist.
Current profit is +- 130 pips.
Ignored
I'm looking for currently area to hold. Let's see how price develop. Make sure you don't give back that nice amount of pips !
G/J working technically good so far. Possible resistance around 213.50 but only time will tell. A good movement (upward) is in favor if price continue to trade above 210, IMO.
Ignored
Hi Aediaz,
Thanks, I had plotted that support already. I am still holding on to my position until th candle closes. I have an auto reopen (SELL) @ 1.5550 if it goes south.
As for GBPJPY, I am long and getting resistance @ 213.20.