Here's some information I received via email from my trade station broker
GBP/USD –
http://fxsolutions.cmail1.com/email/...es/gbp-usd.jpg
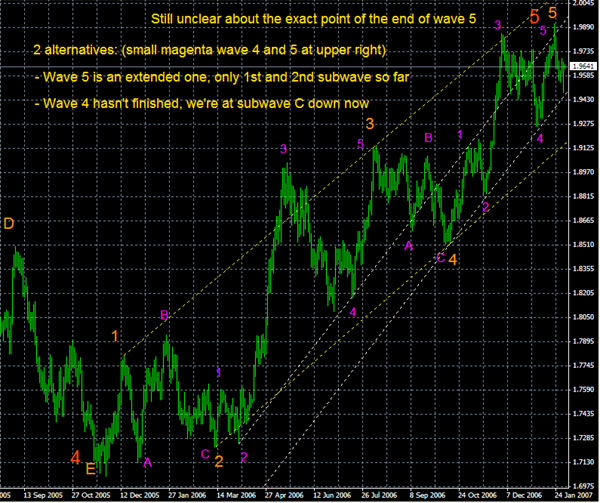
(GBP/USD Daily Chart – Uptrends in green, downtrends in red, pattern formations in blue, horizontal levels in yellow.)
The GBP/USD has also been in somewhat of a ranging mode for the last two weeks. We can see from the chart that the New Year’s breakdown of the minor uptrend support (as indicated by the shortest green uptrend line, on the top) moved the pair decisively down until price hit support at the next, more major uptrend support line (as indicated by the second green uptrend line from the top), which held with conviction. For traders who hunt for breakouts, as well as those who seek trendline bounces, the first few weeks of 2007 were generous for astute technical traders trading Cable.
In any event, after the bounce off the middle uptrend line, price followed-through all the way back up, almost to the underside of the top trendline. This was an almost-classic instance of support becoming resistance. After failing near this resistance, the Cable bull run fell back, and is now hovering around the 50%-61.8% fib retracement levels (the Fib retracement levels having been drawn from the 1/08/07 trough to the 1/23/07 peak). By the way, the peak that occurred about a week ago on the 23rd of January this year surpassed the 14-year high for the pair, which was reached in early December of 2006.
The next obvious level of visual support would reside at the approximate confluence of the 61.8% fib level and the middle uptrend line. This middle uptrend line represents relatively stable support because there have already been three touches of this line. If a breakdown of this line occurs, the next support level would be the last low of around 1.9260. On the upside, we have a resistance level around the previous range resistance (before the peak on 1/23/07) at around 1.9750. This is indicated by the short, yellow horizontal line on the chart.
As is evident on the Slow Stochastics oscillator, price is plainly in oversold territory, and beginning to turn up. In a range trading situation, this may help signal a possible price move up at some point in the very near future.
Once again, Friday’s NFP will lend more clarity to how the technicals will play out on Cable.
GBP/USD –
http://fxsolutions.cmail1.com/email/...es/gbp-usd.jpg
(GBP/USD Daily Chart – Uptrends in green, downtrends in red, pattern formations in blue, horizontal levels in yellow.)
The GBP/USD has also been in somewhat of a ranging mode for the last two weeks. We can see from the chart that the New Year’s breakdown of the minor uptrend support (as indicated by the shortest green uptrend line, on the top) moved the pair decisively down until price hit support at the next, more major uptrend support line (as indicated by the second green uptrend line from the top), which held with conviction. For traders who hunt for breakouts, as well as those who seek trendline bounces, the first few weeks of 2007 were generous for astute technical traders trading Cable.
In any event, after the bounce off the middle uptrend line, price followed-through all the way back up, almost to the underside of the top trendline. This was an almost-classic instance of support becoming resistance. After failing near this resistance, the Cable bull run fell back, and is now hovering around the 50%-61.8% fib retracement levels (the Fib retracement levels having been drawn from the 1/08/07 trough to the 1/23/07 peak). By the way, the peak that occurred about a week ago on the 23rd of January this year surpassed the 14-year high for the pair, which was reached in early December of 2006.
The next obvious level of visual support would reside at the approximate confluence of the 61.8% fib level and the middle uptrend line. This middle uptrend line represents relatively stable support because there have already been three touches of this line. If a breakdown of this line occurs, the next support level would be the last low of around 1.9260. On the upside, we have a resistance level around the previous range resistance (before the peak on 1/23/07) at around 1.9750. This is indicated by the short, yellow horizontal line on the chart.
As is evident on the Slow Stochastics oscillator, price is plainly in oversold territory, and beginning to turn up. In a range trading situation, this may help signal a possible price move up at some point in the very near future.
Once again, Friday’s NFP will lend more clarity to how the technicals will play out on Cable.
All hard work brings a profit, but mere talk leads only to poverty.