DislikedHi, glad you enjoyed this thread.
I'll try and answer indirectly to your question and illustrate with an chart (the concept of HH/HL) and hope to make it understandable
The reason I add LH LL etc is to make an water-proof "trend-analyze" of which way price is channeling so I'm sure which way I should trade. I just can't stand being caught up in the wrong trend. So I consider a trend strong when it makes new HH/HL in a uptrend or LL/LH in a downtrend.
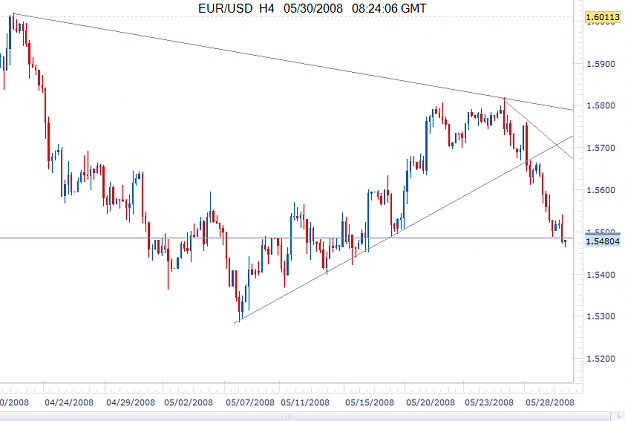
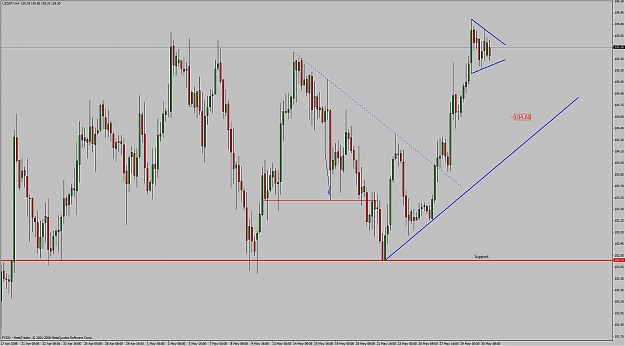
Take a look at this currently uptrend we have seen on e/u.
Here we have an example where HL is taken out. Then we know that currently uptrend have decreased strength and taking long position have higher risk. On this 4h chart, latest LH doesn't seem too logical but if you look at 1h chart you'll see it clearer. So its pretty similar to support/resistance although I don't take trades on HL/LL. It' simply to measure trends strength which is a part of my system.
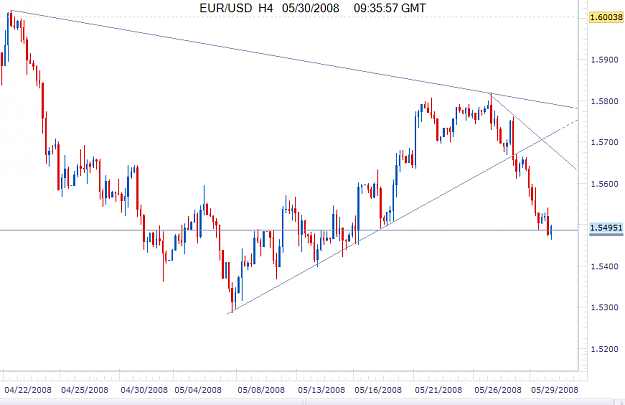
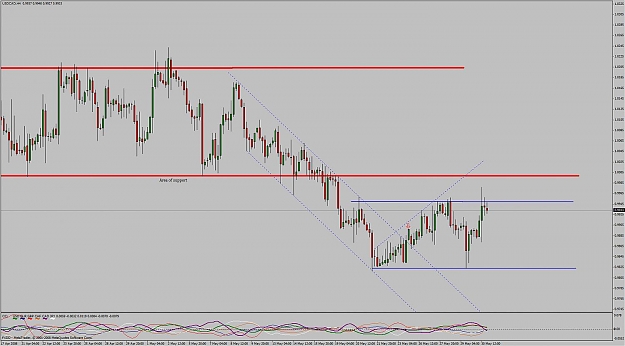
When do we know when downtrend is over on e/u ?
We are (soon) forming new LL on 4h chart as we speak. Let's say price heads above previous LH and don't pull back to this area. Then the probability for more upside is in favor.
Remember that we play with probabilities in this game. Even if price should follow this drawn example and form a new HL, we should know that price could "suddenly" head down south again.Ignored
While looking at your example on EU chart, few questions cross in my mind, hope you don't mind to explain further:
1. to mark the HH/HL and LL/LH swings, which timeframe is most effective (for not too long nor too short but "just-enough" to confirm a solid tradeable trend direction), is it H4 or H1 or ... ?
2. when you draw a downtrend channel, which TL is more important to follow/adjust, the upper or lower one? (vv. for an uptrend channel?)
3. I know best is when we have HH&HL or LL&LH waves (probabilities are more predictable), but sometimes there are HH but also LL swings (and HL but also LH), how to handle these types of wave condition?
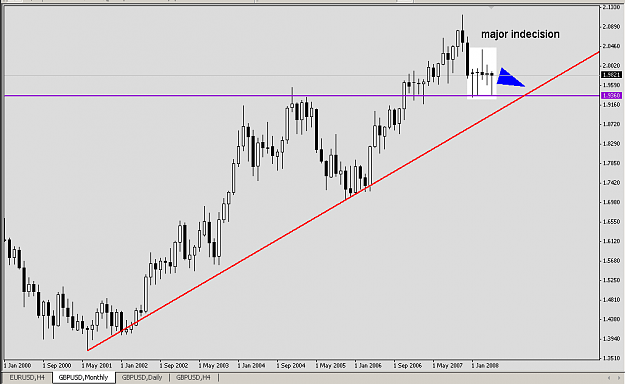
4. referring to your example on EU chart, lets supposed if the price make HH&HL, does it need to break the 1st previous LH&LL or it needs to break even further (the 2nd previous) HL&HH (pls see chart) as to presume the price is heading back north?
Hope this is not too many questions at a time, I'm just afraid I'd forget if not asking them all now
Again thanks, I enjoyed and appreciate it very much!
Attached Image (click to enlarge)