• Home
  • Forums
  • Trades
  • News
  • Calendar
  • Market
  • Brokers
  • Login
  • Join
  • User/Email: Password:
  • 1:05am
Menu
  • Forums
  • Trades
  • News
  • Calendar
  • Market
  • Brokers
  • Login
  • Join
  • 1:05am
Sister Sites
  • Metals Mine
  • Energy EXCH
  • Crypto Craft

Options

Bookmark Thread

First Page First Unread Last Page Last Post

Print Thread

Similar Threads

4 Hour Strategy Macd+other Indicator 21 replies

average true range for 1 hour and 4 hour charts 2 replies

X-1102 1 hour , 4 hour and daily Tf trades 7 replies

Create a verticle line at certain hour for every certain hour 16 replies

Is the "4 Hour Strategy (MACD)" the best system here at FF? 20 replies

  • Commercial Content
  • /
  • Reply to Thread
  • Subscribe
  • 12,921
Attachments: 4 Hour Strategy (MACD)
Exit Attachments

4 Hour Strategy (MACD)

  • Last Post
  •  
  • 1 760761Page 762763764 1578
  • 1 Page 762 1578
  •  
  • Post #15,221
  • Quote
  • May 30, 2008 9:26am May 30, 2008 9:26am
  •  Baggles
  • | Joined May 2008 | Status: Member | 67 Posts
Looking at the EU, price is hovering around the 365EMA. Looking at it, it looks like support. Would the 365EMA be viewed as that, or is the 365 used as a general kind of trend. I haven't read much about the 365 in the pages and wonder why it's there. Just another piece in the puzzle.

Now what I see, price below 200, below 89. According to the heart of the system we would expect a pull back to the 21, to close back at the 89. I'm just itching to get in and go long. (I will not pull the trigger yet though as I am only on my 4th or 5th mental trade on this sytem!)
My question is, does it matter that the 200 is above the 89? Or is it just important that price is below the two at the moment.
 
 
  • Post #15,222
  • Quote
  • May 30, 2008 10:03am May 30, 2008 10:03am
  •  Baggles
  • | Joined May 2008 | Status: Member | 67 Posts
Stop loss 1.5461
TP 1.5595

Entry 1.5508

Why trade:
Price is below 89 and 200. Expected to pull back to 21.
MACD sitting below -0.0045 indicating strongly oversold.
Candle just before has a long tail down.


Why not to trade:

http://www.forexfactory.com/images/misc/progress.gif


  • Post #15,223
  • Quote
  • May 30, 2008 11:13am May 30, 2008 11:13am
  •  Phillip Nel
  • | Commercial Member | Joined Nov 2006 | 2,223 Posts
Quoting Baggles
Disliked
Stop loss 1.5461
TP 1.5595

Entry 1.5508

Why trade:
Price is below 89 and 200. Expected to pull back to 21.
MACD sitting below -0.0045 indicating strongly oversold.
Candle just before has a long tail down.


Why not to trade:

http://www.forexfactory.com/images/misc/progress.gif

Ignored
That is taking the odds on and the odds should be in your favour. You should score with this one.
 
 
  • Post #15,224
  • Quote
  • May 30, 2008 12:01pm May 30, 2008 12:01pm
  •  Hookem28
  • | Joined Sep 2007 | Status: Member | 438 Posts
Nice trade Baggles!
I slept through that one.
 
 
  • Post #15,225
  • Quote
  • May 30, 2008 12:07pm May 30, 2008 12:07pm
  •  juang
  • | Joined Dec 2007 | Status: Member | 89 Posts
Quoting Shermenator
Disliked
we had a cross of the 0 line on the daily does this add Buying pressure since is from the daily chart or do you give prefrence to the round top on the 4 hour chart?
Ignored

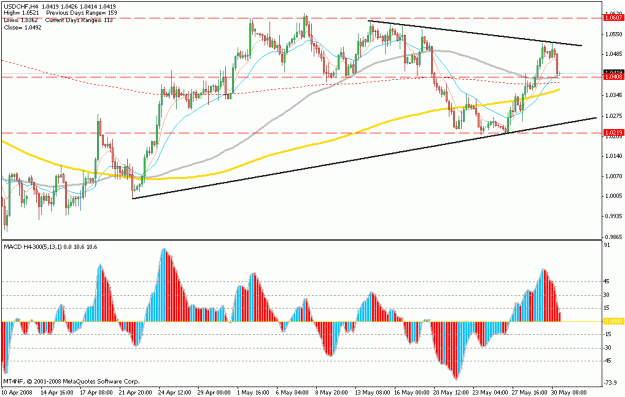
Round top ussualy counter trend but for usdchf now,we get reason for CT coz usd chf have resistance and get area macd 45 ,look my chart,after fourth candle can't break up,and R:R is ok,thanks,Thanks to Master Philip.


"Together More Better Than Alone"
Attached Image (click to enlarge)
Click to Enlarge

Name: usdchf.gif
Size: 18 KB
 
 
  • Post #15,226
  • Quote
  • May 30, 2008 3:27pm May 30, 2008 3:27pm
  •  Seki
  • | Joined May 2008 | Status: Member | 161 Posts
Hi to All
Will join this thread to learn from experienced traders. No objections?
Thnx
 
 
  • Post #15,227
  • Quote
  • May 30, 2008 4:47pm May 30, 2008 4:47pm
  •  napeharm
  • | Joined Nov 2006 | Status: napeharm | 411 Posts
Quoting Seki
Disliked
Hi to All
Will join this thread to learn from experienced traders. No objections?
Thnx
Ignored

Everyone is welcome Seki.
 
 
  • Post #15,228
  • Quote
  • May 30, 2008 7:15pm May 30, 2008 7:15pm
  •  Pipmaniac
  • | Joined Jan 2008 | Status: Be behind the breakout | 42 Posts
This is my first post in this thread, and first of all I would like to thank Phillip Nel for all the energy and love he puts in this thread to educate us all, and all the others offcourse who keep this thread alive
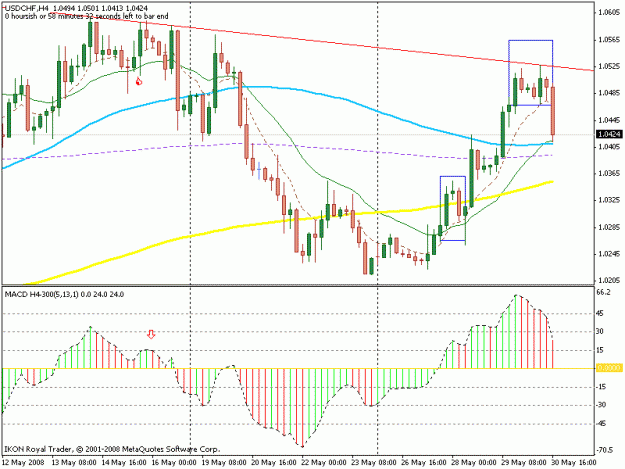
On the following 4H chart of usd/chf I see a possible trading opportunity with a high probability,the price break through the 89(dotted line) went up about 100pips and came back to the 89 and 21 MA. the current price level in which the price sits at the moment, seems to be a very strong s/r line, during the last three months the trend changes one's way.
As the rule says ,after a breakthrough of the 89 and a turning to the 89 a new trend is about to beginn.
But while looking at the daily chart of the usd/chf I become a little bit confuse. It looks like the price is dancing around the 89 and is going to found once again support on the 89. The emotions of the people might not be unified yet.
Is this a reason to miss the signal on the 4h chart or have I done my homework goog enough?
Attached Images (click to enlarge)
Click to Enlarge

Name: 4hourusdchf.gif
Size: 20 KB Click to Enlarge

Name: dailyusdchf.gif
Size: 18 KB
 
 
  • Post #15,229
  • Quote
  • May 31, 2008 12:35am May 31, 2008 12:35am
  •  ira
  • | Joined Mar 2007 | Status: Member | 667 Posts
Quoting Pipmaniac
Disliked
This is my first post in this thread, and first of all I would like to thank Phillip Nel for all the energy and love he puts in this thread to educate us all, and all the others offcourse who keep this thread alive
On the following 4H chart of usd/chf I see a possible trading opportunity with a high probability,the price break through the 89(dotted line) went up about 100pips and came back to the 89 and 21 MA. the current price level in which the price sits at the moment, seems to be a very strong s/r line, during the last three months the trend changes one's way.
As the rule says ,after a breakthrough of the 89 and a turning to the 89 a new trend is about to beginn.
But while looking at the daily chart of the usd/chf I become a little bit confuse. It looks like the price is dancing around the 89 and is going to found once again support on the 89. The emotions of the people might not be unified yet.
Is this a reason to miss the signal on the 4h chart or have I done my homework goog enough?
Ignored
If there would be BOZ and emtions (I like when price shows that it has found support on the MA, with tails through it) why not. The only consern is that price made HL, and pull back is not smooth, but harsh. I would go to b/e as soon as possible and watch for possible turn around 10500 level.
 
 
  • Post #15,230
  • Quote
  • Edited at 5:46am May 31, 2008 5:00am | Edited at 5:46am
  •  napeharm
  • | Joined Nov 2006 | Status: napeharm | 411 Posts
Quoting Pipmaniac
Disliked
This is my first post in this thread, and first of all I would like to thank Phillip Nel for all the energy and love he puts in this thread to educate us all, and all the others offcourse who keep this thread alive
On the following 4H chart of usd/chf I see a possible trading opportunity with a high probability,the price break through the 89(dotted line) went up about 100pips and came back to the 89 and 21 MA. the current price level in which the price sits at the moment, seems to be a very strong s/r line, during the last three months the trend changes one's way.
As the rule says ,after a breakthrough of the 89 and a turning to the 89 a new trend is about to beginn.
But while looking at the daily chart of the usd/chf I become a little bit confuse. It looks like the price is dancing around the 89 and is going to found once again support on the 89. The emotions of the people might not be unified yet.
Is this a reason to miss the signal on the 4h chart or have I done my homework goog enough?
Ignored
Firstly welcome to the thread. I have seen your name at the bottom of the screen often, but we have not heard from you. I am not really going to answer your enquiry. Partly because i dont really care what the price is going to do next. I never think too much about that, what is more important to me is........what am i going to do about it when that moment arrives for taking action.

I think ,in this regard, that these things will take care of themselves. Maybe it is wise to think things over but without making a decision at the present time, just bear in mind the possibilities. It is far too early to think about whether you would take this or that decision.

The important aspect of your post for me though, is your charts. I really like them. I think your lines are well drawn and your analysis spot on, so well done to you!.

I am posting my versions, which are pretty much the same as your own, except white, which makes them alittle clearer. What we can see, as you so rightly point out, is that the USDCHF is in a channel at present. Price action tells us that you can define such a channel and also locate the middle line, or price pivot also. You have shown this very well, and also that the price has stopped directly on it. The 89sma is also there, and because the price finds both the 89sma and the price pivot supportive ,it is no surprise that the price has stopped.

I did show this to Sukarno on May28th, post 15152, concerning the USDJPY. Then, the price also has stopped on the price pivot and then broken out of the resistance line and headed to within 5 pips of the upper channel boundary. Those using trailing stops would have lost out here as usual, those using their full chart analysis would have correctly spotted the exit and taken the full amount.

So, what i am saying is be as mindful of what is going on as you can, be prepared for any eventuality, but do not be in any hurry to make decisions. Wait and see.

I see from your profile that you are 21. That is a great age to begin trading when your mind is fresh and your brain is uncluttered and ready for use. It is your best trading tool so use it to its fullest.

Good luck with your trading.
Attached Images (click to enlarge)
Click to Enlarge

Name: may.31.chf.gif
Size: 25 KB Click to Enlarge

Name: may.31.chf2.gif
Size: 19 KB Click to Enlarge

Name: may.31.chf23daily.gif
Size: 19 KB
 
 
  • Post #15,231
  • Quote
  • May 31, 2008 5:44am May 31, 2008 5:44am
  •  napeharm
  • | Joined Nov 2006 | Status: napeharm | 411 Posts
Just to continue the analysis of the USDCHF. From the daily chart in my post you can also see the price has made a higher low, suggesting further upward moves. Also the price has come back top test a support level possibly before moving higher. What was previously a resistance level has become support.

Further, if we analyse the monthly chart, we can see that is has formed a two bar high with a high close. This months trading has broken that resistance level. This present month has also formed a possible pin bar and so i will be cautious about suggesting any direction with certainty. Time will tell.
Attached Image (click to enlarge)
Click to Enlarge

Name: may.31.chf23.month;y.gif
Size: 14 KB
 
 
  • Post #15,232
  • Quote
  • May 31, 2008 6:12am May 31, 2008 6:12am
  •  sonicdeejay
  • | Commercial Member | Joined Mar 2008 | 9,228 Posts
Quoting napeharm
Disliked
Firstly welcome to the thread. I have seen your name at the bottom of the screen often, but we have not heard from you. I am not really going to answer your enquiry. Partly because i dont really care what the price is going to do next. I never think too much about that, what is more important to me is........what am i going to do about it when that moment arrives for taking action.

I think ,in this regard, that these things will take care of themselves. Maybe it is wise to think things over but without making a decision at the present time, just bear in mind the possibilities. It is far too early to think about whether you would take this or that decision.

The important aspect of your post for me though, is your charts. I really like them. I think your lines are well drawn and your analysis spot on, so well done to you!.

I am posting my versions, which are pretty much the same as your own, except white, which makes them alittle clearer. What we can see, as you so rightly point out, is that the USDCHF is in a channel at present. Price action tells us that you can define such a channel and also locate the middle line, or price pivot also. You have shown this very well, and also that the price has stopped directly on it. The 89sma is also there, and because the price finds both the 89sma and the price pivot supportive ,it is no surprise that the price has stopped.

I did show this to Sukarno on May28th, post 15152, concerning the USDJPY. Then, the price also has stopped on the price pivot and then broken out of the resistance line and headed to within 5 pips of the upper channel boundary. Those using trailing stops would have lost out here as usual, those using their full chart analysis would have correctly spotted the exit and taken the full amount.

So, what i am saying is be as mindful of what is going on as you can, be prepared for any eventuality, but do not be in any hurry to make decisions. Wait and see.

I see from your profile that you are 21. That is a great age to begin trading when your mind is fresh and your brain is uncluttered and ready for use. It is your best trading tool so use it to its fullest.

Good luck with your trading.
Ignored
Looks like USD/CHF, break out in a making!!

sonic
 
 
  • Post #15,233
  • Quote
  • May 31, 2008 6:25am May 31, 2008 6:25am
  •  Pipmaniac
  • | Joined Jan 2008 | Status: Be behind the breakout | 42 Posts
Thank you for your fast answers, I didn't made any decision yet , just imagine a possible trade.I use to do this before the correct signal came by the macd to confirm my expectations.I will keep your words in my mind, I rush sometimes to take trade and regret my decision very fast.
 
 
  • Post #15,234
  • Quote
  • May 31, 2008 7:37am May 31, 2008 7:37am
  •  fena74
  • | Joined Nov 2007 | Status: Member | 76 Posts
Hi everybody,
Again I have a question while I backtesting EUR/USD.If I want to buy and it is TC and we have a signal from MASD and the price is over 89EMA-everything is ok,but as the rules the price after crossing 89 will turn back to 21 before continue his TC way.The question I want to ask is-what about if at that moment 21 is under 89EMA?For perfect setup,has 21 to be over 89 too?Thank you in advance.
 
 
  • Post #15,235
  • Quote
  • May 31, 2008 12:07pm May 31, 2008 12:07pm
  •  ira
  • | Joined Mar 2007 | Status: Member | 667 Posts
Quoting fena74
Disliked
Hi everybody,
Again I have a question while I backtesting EUR/USD.If I want to buy and it is TC and we have a signal from MASD and the price is over 89EMA-everything is ok,but as the rules the price after crossing 89 will turn back to 21 before continue his TC way.The question I want to ask is-what about if at that moment 21 is under 89EMA?For perfect setup,has 21 to be over 89 too?Thank you in advance.
Ignored
Not necessary, if 21 is under 89, then the retracment would be to the 89. Price will move to the MA which comes first (21 or 89 or even 8).
 
 
  • Post #15,236
  • Quote
  • May 31, 2008 12:35pm May 31, 2008 12:35pm
  •  fena74
  • | Joined Nov 2007 | Status: Member | 76 Posts
Thank you Ira.I understand now everything you said to me.So my mind is better clear now .Thank you.
 
 
  • Post #15,237
  • Quote
  • May 31, 2008 3:59pm May 31, 2008 3:59pm
  •  ira
  • | Joined Mar 2007 | Status: Member | 667 Posts
Quoting fena74
Disliked
Thank you Ira.I understand now everything you said to me.So my mind is better clear now .Thank you.
Ignored

You are welcome. Take your time, I had my headaches too at the begining and was overhelmed with the amount of information. But now it's very natural, I don't even think about it much. You are doing very well that you have started from backtesitng!!!! Well done! You won't regret a minute spend on it, it will help you to gain experience and confidence.
 
 
  • Post #15,238
  • Quote
  • Jun 1, 2008 3:41am Jun 1, 2008 3:41am
  •  ejiexe
  • | Joined Mar 2007 | Status: Senior Member | 955 Posts | Online Now
Quoting fena74
Disliked
Hi everybody,
Again I have a question while I backtesting EUR/USD.If I want to buy and it is TC and we have a signal from MASD and the price is over 89EMA-everything is ok,but as the rules the price after crossing 89 will turn back to 21 before continue his TC way.The question I want to ask is-what about if at that moment 21 is under 89EMA?For perfect setup,has 21 to be over 89 too?Thank you in advance.
Ignored
Ira has answered your question and I am sure your backtesting will surely pay you. Meanwhile, when price is over 89EMA or price move through 89EMA it tends to come back to 21 before continue the trend. That is the rule and NOT THAT IT WILL TURN BACK TO 21 BEFORE CONTINUE TC. It all depends on the momentum. It might even bounce twice from 8 before attempting 21 and by then 21 must have passed over 89. So if the momentum is strong and the price bounce from 8 with MACD confirmation, the signal can be taken.
THE DIFFERENCE BETWEEN GOOD AND EXCELLENT IS ATTENTION TO DETAILS.
 
 
  • Post #15,239
  • Quote
  • Jun 1, 2008 7:32am Jun 1, 2008 7:32am
  •  FJSkli
  • | Joined Apr 2008 | Status: Member | 6 Posts
Can you advise me some literature?
 
 
  • Post #15,240
  • Quote
  • Jun 1, 2008 8:44am Jun 1, 2008 8:44am
  •  Baggles
  • | Joined May 2008 | Status: Member | 67 Posts
Quoting Phillip Nel
Disliked
That is taking the odds on and the odds should be in your favour. You should score with this one.
Ignored
Yes, I got that one right, but because it was my first trade, and late at night I got cold feet and closed after 8 pips profit. I'm going to try to look for TC patterns for the next few trades as you recommend for new guys.

By the way thank you to everyone on this thread for helping me to get this far.
 
 
  • Commercial Content
  • /
  • 4 Hour Strategy (MACD)
  • Reply to Thread
    • 1 760761Page 762763764 1578
    • 1 Page 762 1578
0 traders viewing now
  • More
Top of Page
  • Facebook
  • Twitter
About FF
  • Mission
  • Products
  • User Guide
  • Media Kit
  • Blog
  • Contact
FF Products
  • Forums
  • Trades
  • Calendar
  • News
  • Market
  • Brokers
  • Trade Explorer
FF Website
  • Homepage
  • Search
  • Members
  • Report a Bug
Follow FF
  • Facebook
  • Twitter

FF Sister Sites:

  • Metals Mine
  • Energy EXCH
  • Crypto Craft

Forex Factory® is a brand of Fair Economy, Inc.

Terms of Service / ©2022