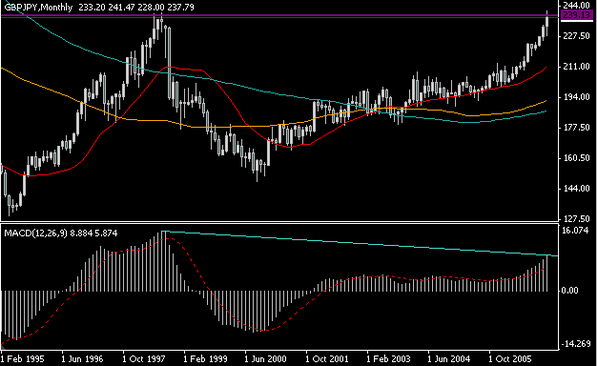
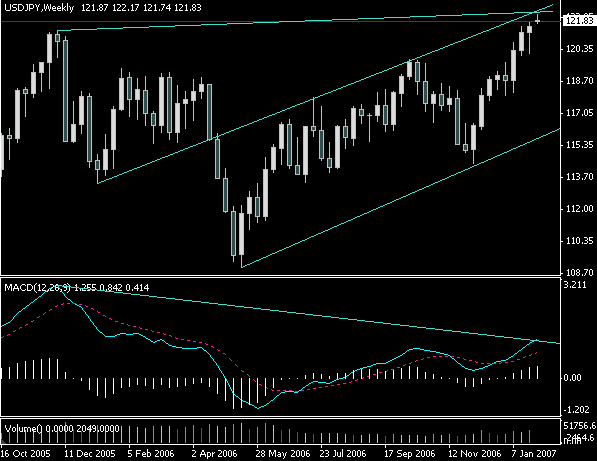
and remember there is a hanging man on that chart too.any comment pls? thx

Where can I learn more about Price Action like those in James16 charts? 9 replies
Dislikedhere is another chart.this is gbp-jy.on 4H.there are 2 signal that potential.the last signal tell me to go long as it double bar higher close.but but if the price go down and there is a 3 match low, it will still go up or go down? thxIgnored
DislikedPin break overnight and retesting low of the first eye was a nice long signal.Ignored
DislikedHi Raczekfx, always nice to see your posts
Speaking of the devil, ey?
Please don't forget that there's two conflicting setups - the BEOB and the PB.
You could also view the pin break as a move back to get sellers for the BEOB. Please be careful...I've conflicting setups for my wavecount as well, but not that I'm any good at that... :/
Like I posted above, if the s/r zones and retrace areas go this could well continue on down....EJ made a 1H bearish Pin altho that's a lower TF....
Just saying that GJ alone would already have moved out 80 from the .618 entry, so never hurts to secure the position
Waiting to see since both EURUSD and GBPUSD also made bullish 4h candles, even though USDCHF did not. (IB there)
Regards,
SeekingLightIgnored
DislikedI went long EJ, based on inside bar on daily, it broke up, I'm managing trade based on 4hr charts, no exit signal yet, looking for a big move up obviously.
westieIgnored
Dislikedwhat indicator is overlayed on your chart. is that bollinger bands x 8?Ignored