Both GBP/USD and EUR/USD seem to be counter trending now and both have broken UST resistance trend lines on the 1H. Both are creating RB's on the 4H MACD BUT the stop is massive on both even if taking the trade on the pullback to the breakout point. If waiting for pullback its around 70 pips for GBP and 60 for EUR. Too much risk it would seem
Ignored
I was thinking about counter trade too on G/U. But as you said above SL was too big. Counter trades are very risky, I would have been stopped already.
Hi Hookem28,
I'm not aware of this setup that you are describing. Would you mind describing how you trade it - is it simply a break of the 2 tweezer top highs? I spend a lot of time going back through the charts looking for setups, how often they occur, success rate, appropriate Stop losses etc. Any info you can pass on would be great.
Thanks, Ben
Ignored
Hi BenStevo.
There were a lot of bullish factors that made this trade high probability. Usually there is a lot of selling pressure near the high of tweezer tops, which makes it strong resistance. I was waiting for a CT trade using the MACD. However, the following 4 hour candle finished near the high of the tweezer tops. Also, . These three candles, along with the large bull candle yesterday, made this trade a high probability one. The previous three one hour candles found support on the 8 MA, giving it further confirmation.
I've only seen this pattern 3 or 4 times over the last few years, but they all ran a good bit after breaking out.
I would have NEVER taken this trade though without the large bull candle yesterday.
I'm definitely not a teacher. Hope this makes sense.
Just a small calculation/illustration for the question of partial profittaking (which was discussed yesterday). So, according to some my setup statistics on EURUSD during the last 2 months, if to take "good" TCs, one could have about 90% chances of reaching the 1st profit target of 23 pips in average and 40% chances of reaching the 2nd profit target of about 63 pips (my targets, your's may be different). Plus 1 loss of 45 pips.
So, if to take these data, let's try 3 different variants:
1) close 1 lot (2x0.5 lot) at the 1st TP;
2) close 0.5 at the 1st TP and another - at the 2nd one;
3) close 1 lot (2x0.5 lot) at the 2nd TP.
Possible results are on the picture below. So, as one could guess, the smaller the target, the higher probability of reaching it and vice versa. V.1 gets the highest % of profits (90%) but the lowest final profit (162 pips/1lot). V.3 brings the highest profit (207 pips/1lot) but has only 40% of profits + 50% of BE. And the 2nd one, described by Phillip in the system, is the compromise variant - we still have 90% profits but final profit is about 10% less than V3.
But, besides maths:
- v.3 with rare big profits is more difficult psychologically (at least for a beginner);
- if to recalculate lot after each position, complex percentage may in the end bring more money on many small (in pips) profits than on several big ones.
Ignored
Thanks for that. For me is the accuracy of the TC very important and the fact that your first target of >20 pips is reached 90% of the time you will get good pips on the second lot when managed well.
Phillip
Just a small calculation/illustration for the question of partial profittaking (which was discussed yesterday). So, according to some my setup statistics on EURUSD during the last 2 months, if to take "good" TCs, one could have about 90% chances of reaching the 1st profit target of 23 pips in average and 40% chances of reaching the 2nd profit target of about 63 pips (my targets, your's may be different). Plus 1 loss of 45 pips.
So, if to take these data, let's try 3 different variants:
1) close 1 lot (2x0.5 lot) at the 1st TP;
2) close 0.5 at the 1st TP and another - at the 2nd one;
3) close 1 lot (2x0.5 lot) at the 2nd TP.
Possible results are on the picture below. So, as one could guess, the smaller the target, the higher probability of reaching it and vice versa. V.1 gets the highest % of profits (90%) but the lowest final profit (162 pips/1lot). V.3 brings the highest profit (207 pips/1lot) but has only 40% of profits + 50% of BE. And the 2nd one, described by Phillip in the system, is the compromise variant - we still have 90% profits but final profit is about 10% less than V3.
But, besides maths:
- v.3 with rare big profits is more difficult psychologically (at least for a beginner);
- if to recalculate lot after each position, complex percentage may in the end bring more money on many small (in pips) profits than on several big ones.
Ignored
Yorik, are you a mathematician? I really like your methodology of statistics. We deed more illustrations using mathmatics way to show a clear picture of trading.
Phillip, Saka, thanks for encouragement! That stimulates me a lot.
I'll gathered 60 EURUSD setups for the last 2 months at the moment and soon hope to post the resulst of their analysis. P.s. I'm not a mathematician (I'd say on the contrary - I'm more a "visual" person and prefer working with images, setups etc) - I'm a physiologist but in the experiments for a PhD one needs to know some statistics.
Thank you for your work. Regarding exit strategie 3, you said 50% would be closed at BE. How did you define which trade was BE and which not? What is the result if you don't manage the trades and just set SL and TP (fire and forget)?
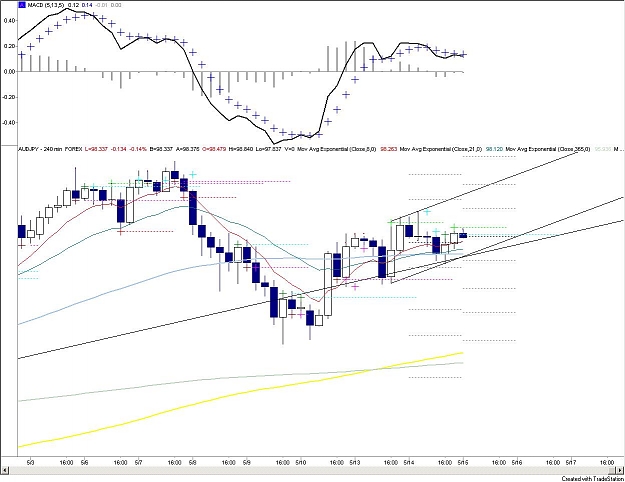
i think usd/jpy showing a round top signal
short opportunity with fairly tight SL seeing the pair potential to continue its bearish bias
hanging man candlestick is a bonus there..
let's see
I Think There's A Signal Here...what Do U Guys Think?
Ignored
Becarefull if you open sell coz its mean counter trend,look my chart usd/jpy have resistance 105.40.just anticipation for breakout to up.please wait for TC on H4 ,you go to H1 if trendline break then pulback to it .then open trade .just my simple analysist.thankss.
I Think There's A Signal Here...what Do U Guys Think?
Ignored
You need to scroll backwards to gain more history on this chart so that you can see the 200sma and 365ema and the 89sma is accurate, if you have not already done so.At present you cannot see all of your moving averages.
If you are askling a question about this signal it tells me that you dont have the experience to deal with it. It is a counter trend signal and is a risky trade. Trade trend continuation trades if you want to stay in the game.
Euro; Tricky call straight into the 89sma. Big trendline above is a target for me. GBP and Euro set up for possible gains today, we shall see how it turns out.
@York
Thank you for your work. Regarding exit strategie 3, you said 50% would be closed at BE. How did you define which trade was BE and which not? What is the result if you don't manage the trades and just set SL and TP (fire and forget)?
Thank you in advance, really good work.
Regards
Janson
Ignored
Sorry, I didn't mention that - in the above calculations SL was always moved to BE at the 1st TP level (independent of that was some part of the position closed there or not). So in V.3 among 9 positions price reached TP2 in 4 cases, in all 9 SL was moved to BE and was activated there in 5 cases in which profit was TP1<profit<TP2.
About not changing SL to BE but working only with SL and TP. Such a step, as I understand it, may help to preserve positions from a too early closing before possible big movement. In our case we have about 40% probability to get 63 pips (TP2) and 90% of getting about 23%. That means that in those 4 trades of 9 price didn't touch BE after +23 and reached +63. There really might be some trades when price reached +23, then touched BE and again moved to profit, but I need to chech that on specific trades. Thanks for the question.
EurUsd
Gave TC on 0:00 candle that would have been a wrong deal. (luckily in my sleeping time)The first wrong TC in a long time.
At the moment against the 89sma and top TL still there. Wait for breakout above TL or ZB for a short