Hi Guys/Gals !
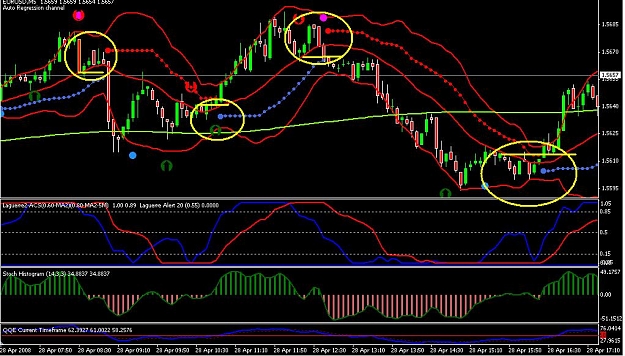
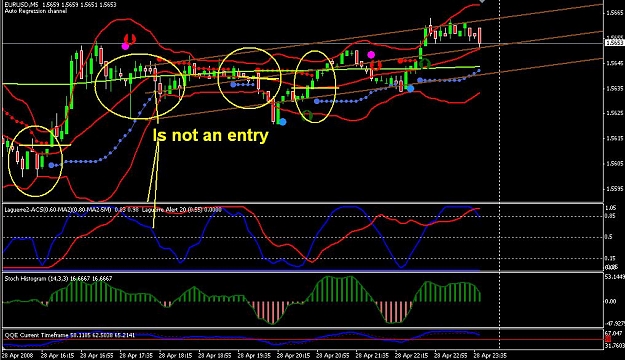
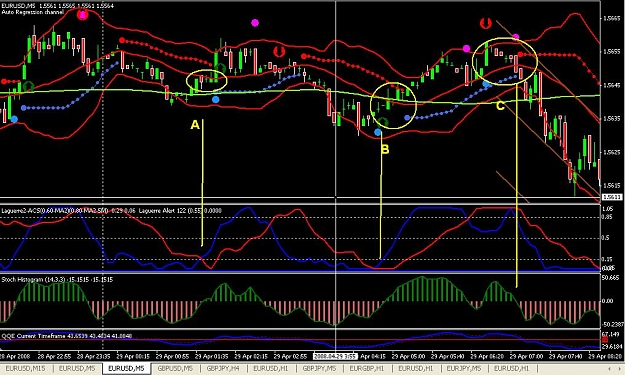
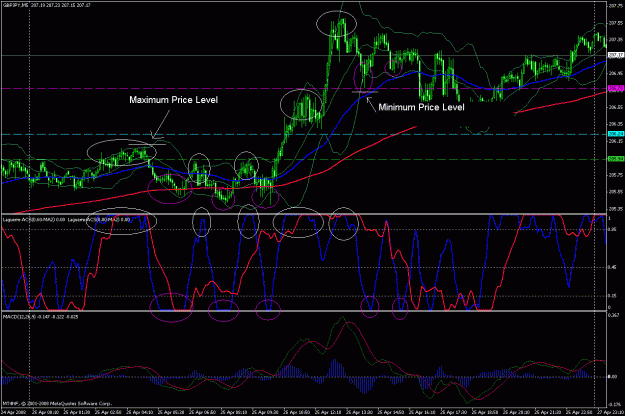
I wish you can see how to put SL's in a sure place. If you see all circles in this chart, after blue lag move up/down of 0.15/0.85, price (in most of times) never reach min/max price level when lag was at top/bottom (it's difficult for explain it, but easy to see it in a chart)
You can use a fixed SL's for your entries if you like, but you must take your entry with 1m chart for no get stopped out.
How you can see, any trades are good, other not. This will depend other factors, but if you go for 1:2 RR trades at least with your risk calculated at this points, then you can obtain very good outcomes
This is same for red lag, only this one, will signal top/bottom of bigger wave.
Feel free to ask me anything you like !
Regards,
Ariel
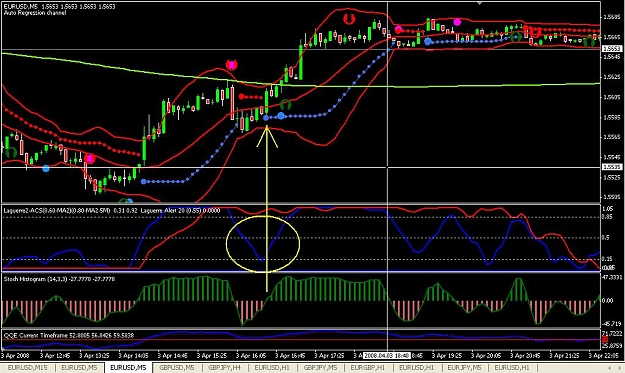
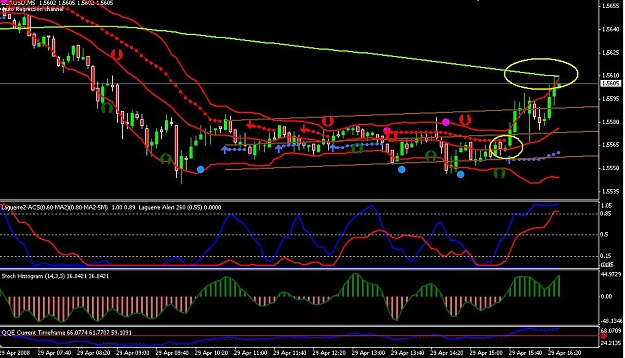
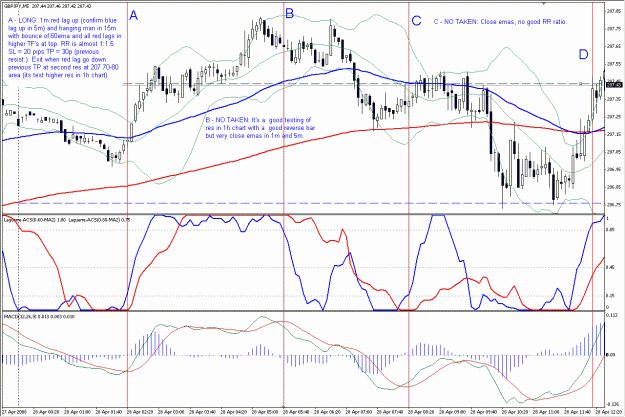
Attached Image (click to enlarge)
Psssst !!!... I have found the Holy Grail !!!.... It's YOU !!!