The other point about Mouteki trendlines is that they are drawn from right to left..........which is not how were are used to drawing them, but they are at least the most current.
Trendlines seem to be a simple thing. But having analysed Phillip's Friday's wrapup, I concluded that I was not as good as I should be - at least partly - because of my trendlines drawing (and so TP and SL putting). Comparing to those trendlines posted by Phillip and the others recently - I sometimes was too "sensitive" (?) - too many lines&channels correction. That was good for me sometimes but sometimes it makes you "not see the forest behind the trees".
Trendlines seem to be a simple thing. But having analysed Phillip's Friday's wrapup, I concluded that I was not as good as I should be - at least partly - because of my trendlines drawing (and so TP and SL putting). Comparing to those trendlines posted by Phillip and the others recently - I sometimes was too "sensitive" (?) - too many lines&channels correction. That was good for me sometimes but sometimes it makes you "not see the forest behind the trees".
Ignored
Yes. I like not to make my TL to many and to complicated. If you use too many togehter with the moving averages it makes it difficult to set a TP. To many barriers to cross.
Quite so, trendlines are not an exact science and are fairly subjective, but at least need to be representative of the direction of the price.
This is my 4hr GBP. The currency is in a pathetic condition at the moment and i wont even consider a trade on it. Another thing worth mentioning about support and resitance lines, and i think it applies equally to trendlines, as in this GBP example, that there can also be a mid point, or price pivot. These are areas which can be traded from also, with the 4hr macd obviously.
The Euro recently wasnt going to provide the best example of a range with a mid point, but it will have to do and makes the point. It is worth bearing in mind because it gives some idea of what to expect from the price. Each range, whatever size, can be so divided. Expecting bounces from mid points and upper amd lower limits of the range can be another collusive factor in the taking of 4hr macd trades.
i've been following this thread and it thought me a lot.
praise for the good job.
couple question that i need philip opinion or maybe from fellow traders as well.
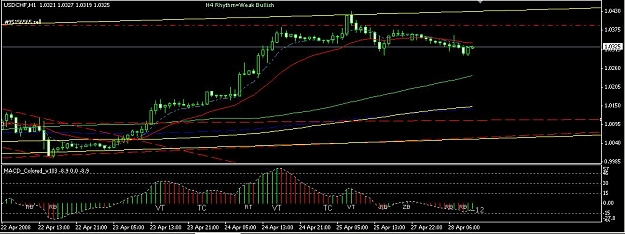
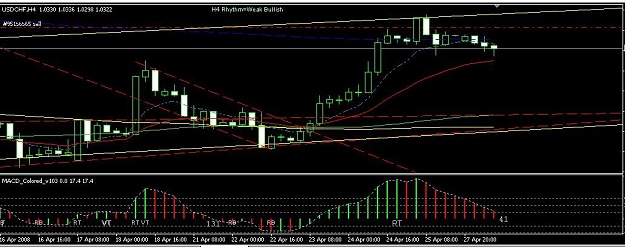
what is your insight for usdchf pair base on your experience.
1. rule says if the price will test again 89SMA after moving its course along 8EMA and 21EMA, according to 4hour chart, definitely it will test again the 89SMA. my question is how do you comment current price action with signal as being given by MACD if you were to compare with your previous post as attach ( BECAREFUL WHEN MACD MOVE IN SUCH SLOPE )
2. If we switch to 1Hour TF, there was a head and shoulder formation formed since 23-25april, which indicate definite trend reversal but the price seems hesitate to go further down and 1hr already forming a round bottom today.
major trend is downward.
daily trend is in upward channel but the price is near upper trendline.
please give some comment as where is the price heading next base on your analysis and experice for short , medium and long term
Just another warning signal. When the MACD comes down or up in such a straight line it means the speed is going to change. The direction is not definitely known beforehand.
i've been following this thread and it thought me a lot.
praise for the good job.
couple question that i need philip opinion or maybe from fellow traders as well.
what is your insight for usdchf pair base on your experience.
1. rule says if the price will test again 89SMA after moving its course along 8EMA and 21EMA, according to 4hour chart, definitely it will test again the 89SMA. my question is how do you comment current price action with signal as being given by MACD if you were to compare with your previous post as attach ( BECAREFUL WHEN MACD MOVE IN SUCH SLOPE )
2. If we switch to 1Hour TF, there was a head and shoulder formation formed since 23-25april, which indicate definite trend reversal but the price seems hesitate to go further down and 1hr already forming a round bottom today.
major trend is downward.
daily trend is in upward channel but the price is near upper trendline.
please give some comment as where is the price heading next base on your analysis and experice for short , medium and long term
thank you
keep up the good work
Ignored
The price is above 89 and has pulled back to 21 so a TC up is what I will be looking at,
thanks for the prompt reply!
in such a case after TC appear, in what relation you aim for your profit taking area ( we are already near upper trend line : daily chart )
i am in short position and planning to take profit around 89SMA but since im in 'counter trend' position, it would be dangerous isnt it?
is there any mean that we can anticipate at which moment the price actualy going to test 89SMA instead going down to 21EMA before going up back again.
Time: EURUSD 12:00 GMT+1 MACD: Possible bearish TC Price: After breaking down SMA89 and SMA200 made a retracement to EMA8&EMA21, and now made some movement down. Calculations:
Open price: 1.5632
SL Price: 1.5695, SL: 63 pips
TP price: 0.5/1.5605, 0.5/1.5564, TP: 48 (27, 68) pips
SINGLE OPENING.
R:R-ratio: 0.76.
Conclusion: trade is BAD either because of a big SL or poor R:R-ratio. Conclusion:
about 1.5 hours till bar closes on 4H (on 1H no TC - at most BOZ), so will wait but at the moment SL and R:R are bad.
docdollar; I see no clear evidence for a trade on the USD.CHF in either direction. If you want to know when the price is going to trade beyond the 21ema down to the 89sma, the macd system will tell you and give you that confirmation. At the moment you are just guessing.
thanks for the prompt reply!
in such a case after TC appear, in what relation you aim for your profit taking area ( we are already near upper trend line : daily chart )
i am in short position and planning to take profit around 89SMA but since im in 'counter trend' position, it would be dangerous isnt it?
is there any mean that we can anticipate at which moment the price actualy going to test 89SMA instead going down to 21EMA before going up back again.
Ignored
This is the only options I will be waiting for. If there is TL then determine the Risk:Reward Ration to the TL and if smaller then 1 then sit out.
I have looked at many years history on the 4hr charts, my conclusion,other than not counter trend trading, is to pick your target, make it a short achievable one and get out with what you can. In the case of the USD.CHF that would be an exit at the low from the previous day which would give you possibly +24 minus the spread. But you have got to ask yourself is it worth it?
i'm already out of the position . the price seems going up.
in the case of usdchf, what if the profit taking area if one bought at the 21EMA besides reversal signal given by MACD?
if we are in counter trend mode it is easy as we can see the profit taking area given by price action, 21EMA, 89SMA and such.
i couldnt find the explanation in the thread.
please enlight me..very much appreciate that
hm, i got that TL diffrently than yours..no wonder i interpreted it differently.
yours is already showing breaking of that upper TL whereas mine is still not.
this is the purpose of discussion after all..
thank a lot for your insight.
still waiting for green candle for TC, hope can get some pips before the news coming later this week.
by the way, do you have specific strategy in trading the news phil?
tq