• Home
  • Forums
  • Trades
  • News
  • Calendar
  • Market
  • Brokers
  • Login
  • Join
  • User/Email: Password:
  • 4:05am
Menu
  • Forums
  • Trades
  • News
  • Calendar
  • Market
  • Brokers
  • Login
  • Join
  • 4:05am
Sister Sites
  • Metals Mine
  • Energy EXCH
  • Crypto Craft

Options

Bookmark Thread

First Page First Unread Last Page Last Post

Printable Version

Similar Threads

USD/TRY and EUR/TRY 11 replies

Moving averages in its own indicator window 7 replies

Displaced Moving Average (DMA) Indicator 2 replies

my navigator window displaced - HELP! 2 replies

If it works, it works... 3 replies

  • Trading Discussion
  • /
  • Reply to Thread
  • Subscribe
  • 4
Attachments: Try displaced moving averages, it works!
Exit Attachments

Try displaced moving averages, it works!

  • Post #1
  • Quote
  • First Post: Edited Apr 12, 2008 2:27pm Apr 10, 2008 3:05pm | Edited Apr 12, 2008 2:27pm
  •  iinself
  • | Joined Feb 2008 | Status: Member | 63 Posts
Hi,
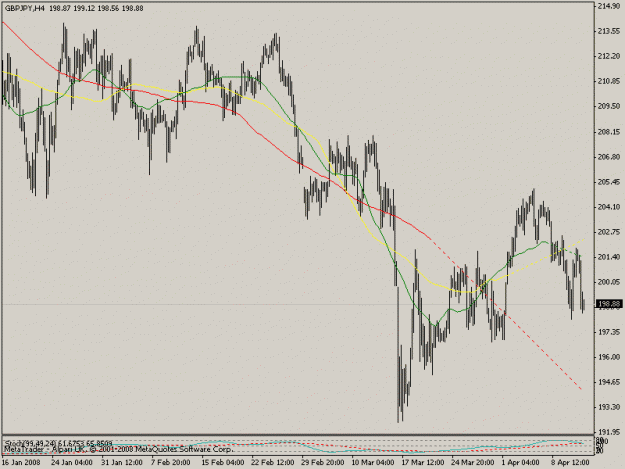
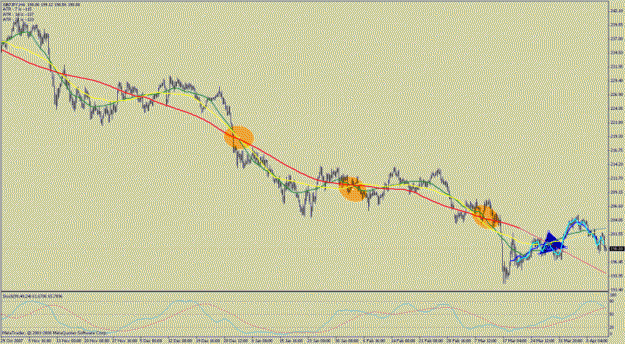
read the book "Profit Magic of transaction timing"; not fully as it is a bit heavy, but the one concept that is worth a million dollars literally is the concept of displaced moving averages, and this works, try it with long periods, I use 199, 99, 49 displaced by half their periods - all using simple averages. You have to use MTF to guess the direction of the wave next, I start of with the D1 then move down to M5 using stochastic oscillator for confirmation/filter.

You just need to go with the sinusoidal waves and extrapolate. It comes easily with some practice. Try using "vhandstrade" for practice.

I use large stop losses like 100 pips for 10 pips of profit, I know this is not a good approach but I have just started will need to work on this.
It is toooo eazee :thumbsup:
  • Post #2
  • Quote
  • Apr 10, 2008 3:24pm Apr 10, 2008 3:24pm
  •  ForexCTG
  • | Joined Mar 2008 | Status: Member | 15 Posts
Please share some charts along with specific instructions and all indicators you use with your system.
  • Post #3
  • Quote
  • Edited Apr 14, 2008 5:45pm Apr 10, 2008 5:40pm | Edited Apr 14, 2008 5:45pm
  •  iinself
  • | Joined Feb 2008 | Status: Member | 63 Posts
Hi ForexCTG,
4 indicators:
3 simple moving averages of 199, 99, 49 displaced backwards by -99, -59, -24
Stochastic osicallator % K - 99, % D - 49 and slowing 24.

You will observe that 49 DMA (displaced moving average) weaves itself around 99 DMA and 99 around 199. Also observe that they try to form symmeterical sine waves most of the time, with this knowledge we extrapolate the waves.

I am attaching the indicator and template for your convenience, hope you find it useful. Also please don't forget to study MTF context for the same setup before making the decision.
Attached Files
File Type: mq4 AA$-Hurst Displaced MA.mq4   3 KB | 3,024 downloads
File Type: tpl hurst1.tpl   3 KB | 2,127 downloads
It is toooo eazee :thumbsup:
  • Post #4
  • Quote
  • Apr 12, 2008 10:51am Apr 12, 2008 10:51am
  •  forexmoments
  • | Commercial Member | Joined Dec 2007 | 1,927 Posts
Thanks for this. Never really looked into Hurst, not really a fan of moving avergaes, but will check this out.
  • Post #5
  • Quote
  • Apr 12, 2008 11:16am Apr 12, 2008 11:16am
  •  Poocher
  • | Joined Dec 2006 | Status: Poocher | 1,015 Posts
Hurst's book has got many people over the years interested in technical analysis including me.

Thanks Iinself for the indicators.

On the 4hr. guppy I can see where the long term red ma. may have given direction and the yellow and black gave some support and resistance.

...any other insights???

Attached Image (click to enlarge)
Click to Enlarge

Name: 1111111111111111.gif
Size: 15 KB
  • Post #6
  • Quote
  • Edited at 2:28pm Apr 12, 2008 11:58am | Edited at 2:28pm
  •  iinself
  • | Joined Feb 2008 | Status: Member | 63 Posts
[Picture
Our main theory is that these lines try to stay symmetrical and follow a sine wave. And also they all try to meet up at a given point so if 2 of them meet we can say the third slower one will also try to move towards that meeting point. The orange circles and blue triangle.

Since the long term red just finished it very small uptrend it is now going to move down. Remember its weight is much more than the other 2 lines. So even small curves in it effect large price movements. We will try to go as much as possible with the long term trend. You will need to go one time frame higher to confirm, maybe the D1 chart. But when you go higher timeframe use short DMAs like 21, -11, 5, -3 etc.

Next we look at the yellow and it is about to start going down to stay symmetrical around the red line. Observe the meeting points - all the 3 lines tend to meet at one point

Next look at the meeting point of green and yellow and use that as the middle of that sine wave move. From this it looks like the green has finished its uptrend and is about to move down.


The red line should try to make it thro' the blue triangle. We will have to now anticipate how price motion can bring the line thro that triangle.

FOr all this to happen that the price can move sideway and down, thus it would be a good idea to go short on guppy for the next few days.

the sentences above are very unstructured but hope it helps.
Attached Image (click to enlarge)
Click to Enlarge

Name: dma1.gif
Size: 70 KB
It is toooo eazee :thumbsup:
  • Post #7
  • Quote
  • Edited at 2:27pm Apr 12, 2008 12:11pm | Edited at 2:27pm
  •  iinself
  • | Joined Feb 2008 | Status: Member | 63 Posts
Hi Poocher,
as you can see I don't support and resistance concepts that much, I know I should be but for now I am trying to use Hurst's priniciples alone. It is all about wave formation and trying to see symmetery. Ofcourse it is not going to work all the time that is where stop loss has to come in. In testing found that I could make many many profitable trades before I made a loss without stop loss but it is too risky. Another key is using MTF and tunning the displaced moving averages (dma) -- for higher tfs use shorted dmas and vice versa. But on all tf keep the sine wave in the guiding principle.

I am still early and learning on this method, so my enthusiasm for this may die if it was all beginners luck
It is toooo eazee :thumbsup:
  • Post #8
  • Quote
  • Apr 12, 2008 1:03pm Apr 12, 2008 1:03pm
  •  tdion
  • Joined Nov 2005 | Status: EURUSD Quant FREAK | 3,197 Posts
Looks random to me. If you can make sense of that, post some live calls and start a following.
  • Post #9
  • Quote
  • Mar 7, 2011 2:38pm Mar 7, 2011 2:38pm
  •  Speculator77
  • | Joined Dec 2010 | Status: Junior Member | 1 Post
thank you so much for your useful indicator
  • Post #10
  • Quote
  • Oct 28, 2013 12:15am Oct 28, 2013 12:15am
  •  chris2020
  • | Joined Oct 2008 | Status: Member | 24 Posts
Hi Iinself and everyone,

Any new information or indicators using Hurst Cycles?

Thank you!

Chris


Quoting iinself
Disliked
Hi Poocher, as you can see I don't support and resistance concepts that much, I know I should be but for now I am trying to use Hurst's priniciples alone. It is all about wave formation and trying to see symmetery. Ofcourse it is not going to work all the time that is where stop loss has to come in. In testing found that I could make many many profitable trades before I made a loss without stop loss but it is too risky. Another key is using MTF and tunning the displaced moving averages (dma) -- for higher tfs use shorted dmas and vice versa. But...
Ignored
  • Post #11
  • Quote
  • Nov 22, 2013 1:24pm Nov 22, 2013 1:24pm
  •  Derek Frazie
  • | Joined Nov 2013 | Status: Junior Member | 2 Posts
Make a killing with Hurst if you want more knowledge, its out there. Can we post links here or no?
I think you should put up a 20 DMA displaced by 11 and see what you see when price is at the top or bottom of VWAP and price crosses the DMA in the reversal direction. Hold the trade until the other side of VWAP. It works. Or you can count cycles with Hurst analysis, which is what I do to make money off Oil and Gold. Ill post an example later if one sets up that will be nice to see!
  • Post #12
  • Quote
  • Nov 22, 2013 8:02pm Nov 22, 2013 8:02pm
  •  Scotty B
  • Joined Dec 2007 | Status: Informed | 1,636 Posts
One interesting thing I've done with moving averages is several averages of the original moving average. You basically get a very smooth curve going that gives interesting signals. I'd post a pic if I could but I'm on a computer that won't let me activate certain features in Excel. I'd say as a general rule of thumb that doing things differently or abstractly is usually a good thing as long as you are testing all your ideas statistically.
  • Post #13
  • Quote
  • Nov 23, 2013 10:54pm Nov 23, 2013 10:54pm
  •  Derek Frazie
  • | Joined Nov 2013 | Status: Junior Member | 2 Posts
a 10 DMA ON GOLD displaced 6 is nice on a 1000 tick
  • Post #14
  • Quote
  • Mar 15, 2017 4:36am Mar 15, 2017 4:36am
  •  paul72
  • | Joined Jun 2013 | Status: Member | 132 Posts
hi guys i have been reading up on this hurst way of trading has anyone out there got the indicators that they use for free.
  • Post #15
  • Quote
  • Mar 15, 2017 9:50am Mar 15, 2017 9:50am
  •  yujinngr
  • | Joined Jul 2015 | Status: Junior Member | 3 Posts
seems like a martingale approach would be appropriate
  • Post #16
  • Quote
  • Last Post: Mar 15, 2017 6:33pm Mar 15, 2017 6:33pm
  •  ptla
  • | Joined Feb 2010 | Status: Member | 95 Posts
Hi Derek

vwap dma looks good
I certinally would appreciate more info pls many thanks
  • Trading Discussion
  • /
  • Try displaced moving averages, it works!
  • Reply to Thread
0 traders viewing now
Top of Page
  • Facebook
  • Twitter
About FF
  • Mission
  • Products
  • User Guide
  • Media Kit
  • Blog
  • Contact
FF Products
  • Forums
  • Trades
  • Calendar
  • News
  • Market
  • Brokers
  • Trade Explorer
FF Website
  • Homepage
  • Search
  • Members
  • Report a Bug
Follow FF
  • Facebook
  • Twitter

FF Sister Sites:

  • Metals Mine
  • Energy EXCH
  • Crypto Craft

Forex Factory® is a brand of Fair Economy, Inc.

Terms of Service / ©2021