DislikedHello arezeb,
Let me ask you somthing.. Would you sell everytime when the Stochs are overbought and buy everytime when the stochs are oversold? Have you ever studied the Auslanco's Momentum strategy?
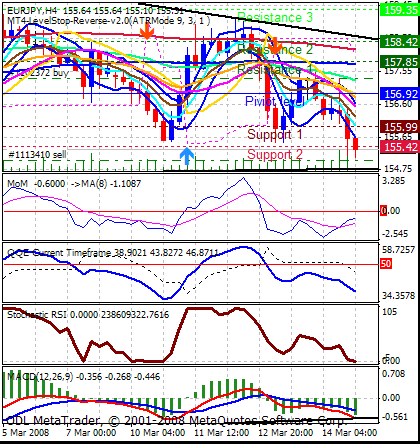
Let me tell you somthing. I have been trading various markets over 8 years now. I have tried over 100 different strategies and almost all the MT4 indicators availble in the world. I was one of the creators of the Auslanco's 15 min strategy based on his 4hr/1hr strategy. I'm not some noob who talks from my A$$. I can tell you honestly ,I havent come across anything even closer to the Mmentum strategy. It's the perfect tool to predict the future market movements. Today's GBP/JPY fall was writen all over on the 12hr Momentum from the London session and supported by weekly 14C, Daily 14C and Monthlly 1C,10Cand 14C. .
Your 10C is useless without the 5sma channel 1C and 14C. So before you laugh at the Momentum indicator learn the full strategy. Because right now , I'm laughing at your stupidity.Ignored
I have taught my girlfreind how to play break outs of the 50 sma on a 5 min chart on the YM (naked charts). No indicators just break outs , with a fudge factor to make sure they are real breakouts. She is currently banking 50 points a day constantly , and she has never traded before. She has done 12 trades with 2 losses.
The reality is that a guy who started kung fu knew that a kick was a kick and a punch was a punch , then he did kung fu and had multiple kicks anp punches to learn , then when he became a master he learned that a kick is a kick and a punch is punch.
Charting is simple when you understand it is simple. It is your mind that is the enemy , entries are easy , staying in the trade and the exit is the hardest part.
The momentum indicator , like any others is a lagging indicator. The GBPJPY is very volatile , therefore 600 pips move down in the gj might not make the momentum indicator turn down. For example today the daily MOM indicator would not be calculated till the end of the day.
It is calculated (( close / (close n periods ago))*100.
It is similar in nature to the ROC indicator.
There is no magic , price and volume is king , volume being more important than price.
From the equation above you can see that momentum is calculated using the close of the bar and is therefore always one bar behind (hence lagging)
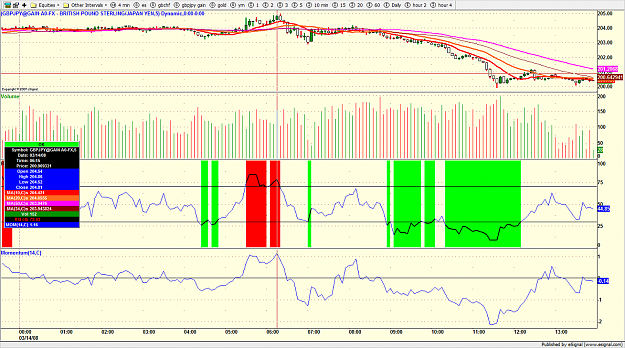
RSI (one of the only indicators that is considered' leading')is the one I like as the rapid rsi predicts and shows areas of support and resistance so well and tells me when the trend is changing. Playing divergences in the rsi work very well as bullish or bearish divergence work better in this indicator than any other indicator. Bearish divergence is what got me out of my long gbpjpy this morning and to get ready for a short , whereas others were looking for a pull back to get long.
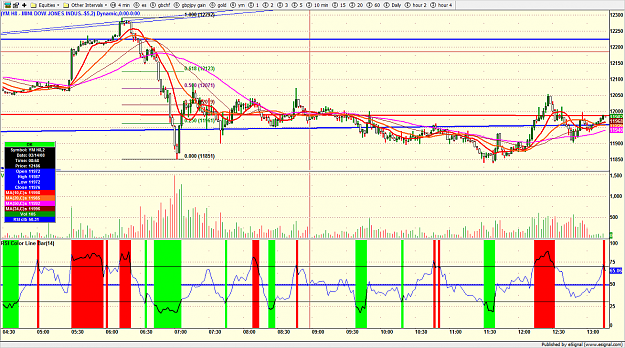
When I trade futures ( and one of the reasons why) I use volume spread analysis.
The chart I get shows me what is going on with the volume as the rsi tells me if there is a pivot point forming. It is colour coded so i do not even have to think about where the pivot points are as the rsi shows me.
If the volume is deminishing and the rapid rsi turns down thru 70 likely hood is that it will be short.
The only issues with forex is that it has not real volume though. There is volume on charts , but i have never worked out what this represents as there is no bid and ask .
However using currency futures I can do volume spread analysis and can use that to get in and out of pairs like usdjpy with ease . Sadly futures only trade for the majors and commodity pairs.
Here is my chart (2min) with the rapid rsi. Look how it showed those points of support and resistance so well on the YM, add volume spread analysis to that and you can see if the triggers are false or not.
Attached Image (click to enlarge)
Blogging daily now at www.volume.zone