Another fairly good trigger on the beast, however triggers were 3 bars apart, but price action showed turn before triggers, so good in my books.
Uptrend for the day.
Found support around daily pivot and in fact found perfect support at weekly pivot and the low point up-sloaping trendline.
Found some resistance at the mid boll band, but that's to be expected. I would assume most stops would have been pushed up to BE and stopped out at this point. However, if you went long at 210.65 where good price action was showing before the triggers, you would still be in even after moving stop to BE.
I'm expecting resistance at 60 EMA. So we will see how it goes.
I have been following this thread for a couple of months now and i just wanted to thankyou all for your contributions as it has made it easy for me to understand and implement the system.
I have been trading forex for over 5 years and lost alot in that time, this is by far the best system i have come accross and so far i am achieving a 90% success rate.
Today i have taken 2 trades a long from 210.32 and closed at 211.72 just short of the daily R2 and a short 211.67 and closed at 210.98 mabe i closed it a little early but cant to greedy.
Anyway i hope to contribute alot more to the thread!
Happy trading!!
Kind Regards
yas
Ignored
well done yas!
please tell me what stop you are using?....i tried to trade today and kept getting stopped......although the trades often continued in the right direction aferwards.....so frustrating when that happens ha ha !!
kim
does anyone know what the inputs should be on this indicator please?
RISK is at 3........what does this mean?
Countbars at 300
is there anuway to get a sound alert when the arrows appear? i am finding that this indiactor is more reliable than LISPA2.....what does anyone else think?
Happy pipping
kim
Yup, I was in yesterday. Good bunch of guys/gals. Worth getting on if you can sort out the problem as it give more confidence to trade with multiple people confirming signals real time. Also, you manage to hear about other pairs you are not watching.
please tell me what stop you are using?....i tried to trade today and kept getting stopped......although the trades often continued in the right direction aferwards.....so frustrating when that happens ha ha !!
kim
Ignored
Hi Kimmy
I use a stop of 30 pips, with a take profit of 50-60 pips, 2:1 ratio if it clears 50 pips clean i move my stop to that level and let it run and close 1/4 lots at key points eg: S1,S2,S3,R1,R2,R3 or daily/weekly pivots 200 EMA depending on which barrier you come up against.
If you are using the 5 min chart and it generates a buy, i tend not to go in straight away, i then look at the 1min chart and wait for the test of either the 60 or 200 ema, or wait wait for the blue lag to go below the 0.15 and then cross over 0.15 and if you enter here it shouldnt go against you more than 5-10pips, this is the point where you are probably getting stopped out.
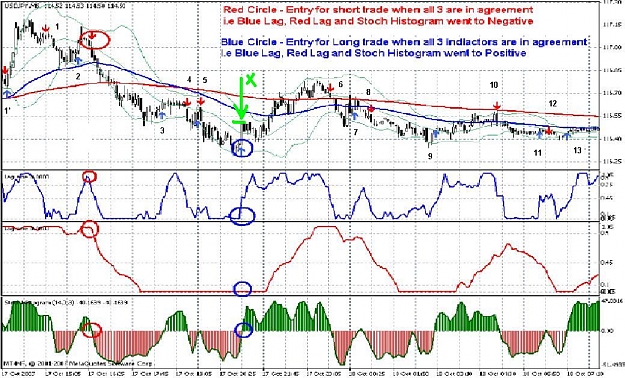
The following chart(attachment) is from Imran's pdf guide (post#1) page 10. I added trades' numbering and a green arrow.
Here go noob Questions:
1. I suppose the small not encircled blue/red arrows stand for secondary(?) long/short positions based on the system signals. I dont see how some of the positions could have been entered based on the alignment of all 3 signals at that timeframe.
long 1': i dont see any signals for that long, more so lag2 is at the top. why long?
short 1: lag1 bottoming,lag2 at the top, stochastic positive. why short?
long 2: conflicting lag2 is above .45 but its 'trending up' is not quite clear until the move from 117 to 117.1 is quite done. Why long then?
...
Short 10: lag2 trending up, stoch still positive... why short?
Were these trades decided for based on perhaps a finer time frame or what am I missing?
2. Regarding the Lags. They often go into a 'saturation',i.e. their dynamic range is brutally cut off.
Wouldn't it be better if it wasn't the case, that is the dynamic range of the lags would not be cut off and the information about the trend/slope of the lags would be fully retained at the bottom/top levels as well?
Or is it perhaps compensated for by lower time frames information?
3.Regarding the long position marked with the green arrow and symbol X (treasure):
I see that the entry does clearly comply with the first set of rulez for longs, but the blue arrow and the circle would indicate that it was entered below 116.40 (i.e. the very lower part of that long white candle).
I don't understand how the signal could be triggered at those levels(already below 116.4), because the lag1(blue) starts showing some trend at best when we are well past at least 50% of the long white candle.
So how could it be entered below 116.4 already?
I use a stop of 30 pips, with a take profit of 50-60 pips, 2:1 ratio if it clears 50 pips clean i move my stop to that level and let it run and close 1/4 lots at key points eg: S1,S2,S3,R1,R2,R3 or daily/weekly pivots 200 EMA depending on which barrier you come up against.
If you are using the 5 min chart and it generates a buy, i tend not to go in straight away, i then look at the 1min chart and wait for the test of either the 60 or 200 ema, or wait wait for the blue lag to go below the 0.15 and then cross over 0.15 and if you enter here it shouldnt go against you more than 5-10pips, this is the point where you are probably getting stopped out.
Regards
Yas
Ignored
Hi yas! congrats for your 90%! is amazing!
Whe u said "wait for a test in 60 or 200EMA", u mean in the 1M?
So, when u see a signal in 5M, down to 1M and wait for the blue lag to go bottom and bounce up?
Please explain me your estrategy for enter a trade, thanks!!!!
1. I suppose the small not encircled blue/red arrows stand for secondary(?) long/short positions based on the system signals....
2. Regarding the Lags. They often go into a 'saturation',i.e. their dynamic range is brutally cut off....
3.Regarding the long position marked with the green arrow and symbol X (treasure):
I see that the entry does clearly comply with the first set of rulez for longs, but the blue arrow and the circle would indicate that it was entered below 116.40...
Thanks for your feedback.
Ignored
Hi frito,
Your attachment did not work. So, I checked with the document and here are some comments.
1. The arrows do not belong to this system. They are likely from another additional confirmation system, not used any more. Just ignore them. Follow only the circles.
2. Lags range only between 0 and 1. So, nothing has been cut-off.
3. That is mistake. Most manually circled charts had that mistake (and most programs also do that). You have to count only after that candle close.
Yup, I was in yesterday. Good bunch of guys/gals. Worth getting on if you can sort out the problem as it give more confidence to trade with multiple people confirming signals real time. Also, you manage to hear about other pairs you are not watching.
Regards,
JC
Ignored
hey jc
sounds just what i need .....hope i can sortout my probs and see you in there
take care
kim
does anyone know what the inputs should be on this indicator please?
RISK is at 3........what does this mean?
Countbars at 300
is there anuway to get a sound alert when the arrows appear? i am finding that this indiactor is more reliable than LISPA2.....what does anyone else think?
Happy pipping
kim
Ignored
Hi Kimmy,
You can check my thread and get the Chandra-SAS5. It can make all the LISPA type alerts for many things (including ASCTrend; read the lengthy details in my thread first post).
I don't know the meaning for Risk=3, but that default seems to be good.
CountBars=300 means do the calculations only for recent 300 bars. If you want to do visual test for longer time, you can increase it (like 20000).
Hi all, as I said I would post my trades so here goes:
I entered the trade as per the 5 minute chart at the first green vertical line. I entered short at 1.0123 and exited at 1.0124.
It was at 10:00 pm EST, so it was the asian session.
As we can see the the MACD and Stoch Histogram both crossed over from positive to negative.
Lags both crossed the .85 level and heading down
The Price was below the daily pivot.
Higher time frame indicators all confirm sell signal.
1 minute time frame also suggested shorting.
However the downtrend was short lived and it suddenly turned around, it flipped. I got out with a 1 pip loss.
The only cons were that the market was in consolidation and the MA's were flat. The MACD was not too high and it was the asian session so volumes were not high and not really liquid.
So please tell me your thoughts.
Thanks.
I'll paste my trading rules in a subsequent post for your review
Ignored
Tradeguru - absolutely nothing wrong with your setup, you need to understand one thing that price action is never in a straight line down/up, it tends to retrace. So with your entry you did not give it enough time to develop, by that I mean, you entered @ 1.0123, your stoploss should have been about 18 pips which is 1.0141 and if you notice it never reached that, at the time you exited the lags ,macd, stoc were still down, later if you notice the price went to 1.0085 = about 40 pips !!! So, once you enter, set a SL, and wait for the ind to actually CROSS to confirm that trend is reversing, stoc came close to to the zero line but never crossed up. Hope this helps and I have seen you present ain the trading room but no chat - why, participate with your questions, man !!
Hi Tradeguru,
here is my personal opinion .. i think your entry was right as u had all the conformation but bb bands were narrow .. macd had not gone anywhere for a while .. and also when the price came down and went up from the down point i believe there was a trend line there .. cos if u look the price had done that one more time before on the left hand of your chart .. so probably was a bounce of a trendline or something !!
thanks,
goodbadmas
P.S. I just checked my charts and yes there was a trendline there and the price bounced of it .. have attached my chart .. sorry if my chart is a mess
ass.wr.wb
CAN U TELL ME (IMRAN OR CHANDRA) iam op buy my sl 60 pip and my target 20 pip but i lose ....can u help what hapen with market..
iam trading last nigt at 23;10 wib(-7 GMT)
but i very2 thank u for u all about this system...trims broo aneh.gif
ass.wr.wb
CAN U TELL ME (IMRAN OR CHANDRA) iam op buy my sl 60 pip and my target 20 pip but i lose ....can u help what hapen with market..
iam trading last nigt at 23;10 wib(-7 GMT)
but i very2 thank u for u all about this system...trims broo aneh.gif