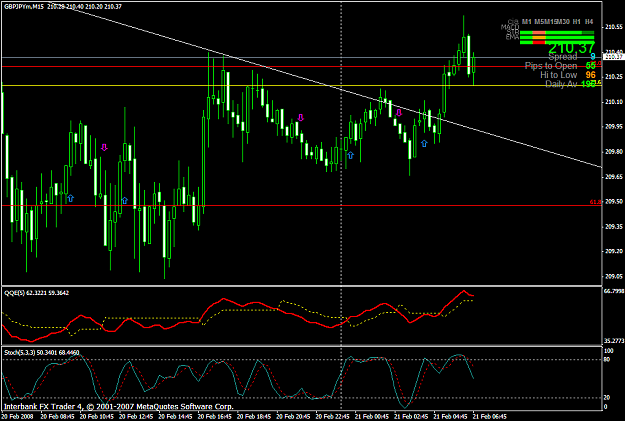
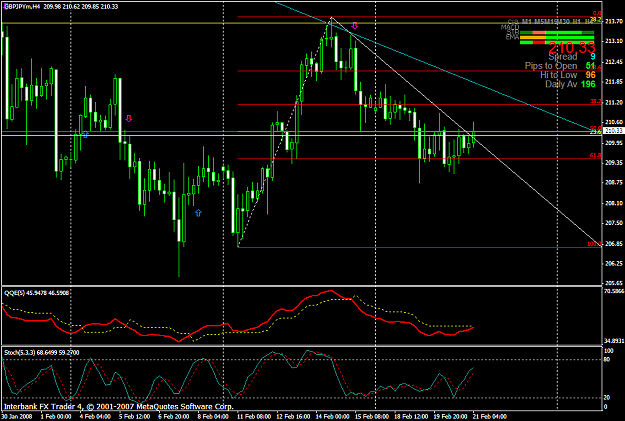
• Home
  • Forums
  • Trades
  • News
  • Calendar
  • Market
  • Brokers
  • Login
  • Join
  • User/Email: Password:
  • 3:38pm
Menu
  • Forums
  • Trades
  • News
  • Calendar
  • Market
  • Brokers
  • Login
  • Join
  • 3:38pm
Sister Sites
  • Metals Mine
  • Energy EXCH
  • Crypto Craft

Options

Bookmark Thread

First Page First Unread Last Page Last Post

Print Thread

Similar Threads

Help needed in OANDA + users from Malaysia 105 replies

  • Interactive Trading
  • /
  • Reply to Thread
  • Subscribe
  • 6,074
Attachments: Malaysia
Exit Attachments
Tags: Malaysia
Cancel

Malaysia

  • Last Post
  •  
  • 1 387388Page 389390391 1224
  • 1 Page 389 1224
  •  
  • Post #7,761
  • Quote
  • Feb 21, 2008 1:51am Feb 21, 2008 1:51am
  •  razergold
  • | Joined Nov 2006 | Status: Member | 43 Posts
Quoting Malaysia
Disliked
The BULL is HOLDING STRONG above the daily PIVOT... closing my SHORT at 15pips RED ... I hit the REVERSE Button... Now I am LONG. QQE H4 is nearly CROSSING upward... If that happen... STRONG BULL bias!!!!
Ignored
Hehe, down again.
 
 
  • Post #7,762
  • Quote
  • Feb 21, 2008 1:52am Feb 21, 2008 1:52am
  •  AmeriTrini
  • Joined Apr 2007 | Status: USF Statistics | 2,248 Posts
Quote
Disliked
Originally Posted by Malaysia http://www.forexfactory.com/images/buttons/viewpost.gif
The BULL is HOLDING STRONG above the daily PIVOT... closing my SHORT at 15pips RED ... I hit the REVERSE Button... Now I am LONG. QQE H4 is nearly CROSSING upward... If that happen... STRONG BULL bias!!!!


Quoting razergold
Disliked
Hehe, down again.
Ignored

you better had an go long!!!


  • Post #7,763
  • Quote
  • Feb 21, 2008 1:53am Feb 21, 2008 1:53am
  •  Malaysia
  • Joined Oct 2007 | Status: Member | 6,522 Posts
Quoting razergold
Disliked
Hehe, down again.
Ignored
Nothing certain yet... still above Daily Pivot. I am BULL bias when the price above Daily Pivot. I will be BEAR bias if the price fall back down below Daily Pivot.
 
 
  • Post #7,764
  • Quote
  • Feb 21, 2008 1:53am Feb 21, 2008 1:53am
  •  fising
  • Joined Nov 2007 | Status: Member | 1,158 Posts
Quoting razergold
Disliked
Hehe, down again.
Ignored
just my opinion...it came back down to retest support. Let's see if it passes the test...if qqe have cross at tf 15..
 
 
  • Post #7,765
  • Quote
  • Feb 21, 2008 1:58am Feb 21, 2008 1:58am
  •  wakli
  • | Joined Dec 2007 | Status: Rock Forever!!!! | 899 Posts
Yep tf15 stoch heading down.....
 
 
  • Post #7,766
  • Quote
  • Feb 21, 2008 2:01am Feb 21, 2008 2:01am
  •  Malaysia
  • Joined Oct 2007 | Status: Member | 6,522 Posts
Quoting fising
Disliked
just my opinion...it came back down to retest support. Let's see if it passes the test...if qqe have cross at tf 15..
Ignored
Just check out the history of QQE M15 crossing .... and compare it with the history of QQE H4 crossing. Interesting huh
Attached Image(s) (click to enlarge)
Click to Enlarge

Name: chart788.PNG
Size: 42 KB
Click to Enlarge

Name: chart789.PNG
Size: 46 KB
 
 
  • Post #7,767
  • Quote
  • Feb 21, 2008 2:12am Feb 21, 2008 2:12am
  •  fising
  • Joined Nov 2007 | Status: Member | 1,158 Posts
Quoting Malaysia
Disliked
Just check out the history of QQE M15 crossing .... and compare it with the history of QQE H4 crossing. Interesting huh
Ignored
yup...bro..
 
 
  • Post #7,768
  • Quote
  • Feb 21, 2008 2:39am Feb 21, 2008 2:39am
  •  Zul
  • | Joined Oct 2007 | Status: Member | 199 Posts
GBP/JPY Intraday London session

1st support: 210.19
2nd support: 209.67
3rd support: 209.05

1st resistence: 210.63
2nd resistence: 210.90
3rd resistence: 211.39

Trend following strategy for short positions can be considered on fail of initial resistences between 210.63 and 210.90 with targets at 210.19 & 209.67 in extension.

Alternative scenario, above 210.90 looks for intraday correction with 211.39 as target.

Comment: On 30 minutes chart the price moving to the upside toward the decline trendline with the RSI turn up signal of posibility of intraday rebound.
Disclaimer-Please Read

All resources are for Educational Purposes Only.

Investing and Trading involves significant financial risk and is not suitable for everyone. Before deciding to invest or trade you should carefully consider your investment objectives, level of experience, and risk appetite. The possibility exists that you could sustain a loss of some or all of your initial investment and therefore you should not invest money that you cannot afford to lose. Investors and Traders should consult with a professional financial advisor for the effects of active investing.
Any opinions, news, research, analyses, prices, or other information is provided as general market commentary and does not constitute investment advice. No acceptance of liability for any loss or damage, including without limitation to, any loss of profit, which may arise directly or indirectly from use of or reliance on such information.
Do Your Due Diligence and take responsibility.
 
 
  • Post #7,769
  • Quote
  • Feb 21, 2008 2:40am Feb 21, 2008 2:40am
  •  ff.alexyong
  • | Joined Dec 2007 | Status: Saturn | 44 Posts
Looks like the trend is on sideway and waiting for 5.30 news, bull or bear.....not sure yet???
May God blessing all of you!
 
 
  • Post #7,770
  • Quote
  • Feb 21, 2008 2:42am Feb 21, 2008 2:42am
  •  fising
  • Joined Nov 2007 | Status: Member | 1,158 Posts
Quoting ff.alexyong
Disliked
Looks like the trend is on sideway and waiting for 5.30 news, bull or bear.....not sure yet???
Ignored
hi ff.alexyong..just wanna share..with u ,,,my personal preview...at TF H4..

Attached Image (click to enlarge)
Click to Enlarge

Name: gj.JPG
Size: 105 KB
 
 
  • Post #7,771
  • Quote
  • Feb 21, 2008 2:44am Feb 21, 2008 2:44am
  •  fising
  • Joined Nov 2007 | Status: Member | 1,158 Posts
Quoting Zul
Disliked
GBP/JPY Intraday London session

1st support: 210.19
2nd support: 209.67
3rd support: 209.05

1st resistence: 210.63
2nd resistence: 210.90
3rd resistence: 211.39

Trend following strategy for short positions can be considered on fail of initial resistences between 210.63 and 210.90 with targets at 210.19 & 209.67 in extension.

Alternative scenario, above 210.90 looks for intraday correction with 211.39 as target.

Comment: On 30 minutes chart the price moving to the upside toward the decline trendline with the RSI turn up signal of posibility of intraday rebound.
Disclaimer-Please Read

All resources are for Educational Purposes Only.

Investing and Trading involves significant financial risk and is not suitable for everyone. Before deciding to invest or trade you should carefully consider your investment objectives, level of experience, and risk appetite. The possibility exists that you could sustain a loss of some or all of your initial investment and therefore you should not invest money that you cannot afford to lose. Investors and Traders should consult with a professional financial advisor for the effects of active investing.
Any opinions, news, research, analyses, prices, or other information is provided as general market commentary and does not constitute investment advice. No acceptance of liability for any loss or damage, including without limitation to, any loss of profit, which may arise directly or indirectly from use of or reliance on such information.
Do Your Due Diligence and take responsibility.
Ignored
thanks for share yor info zul
 
 
  • Post #7,772
  • Quote
  • Feb 21, 2008 3:05am Feb 21, 2008 3:05am
  •  savant
  • Joined Sep 2007 | Status: There Is Always Tomorrow.... | 896 Posts
Seems like everyone is favoring bull.

Set the SL in ... sit back and relax. Good luck !
Monthly Profit & Lost :- May - +85 pips
 
 
  • Post #7,773
  • Quote
  • Feb 21, 2008 3:09am Feb 21, 2008 3:09am
  •  ff.alexyong
  • | Joined Dec 2007 | Status: Saturn | 44 Posts
Quoting fising
Disliked
hi ff.alexyong..just wanna share..with u ,,,my personal preview...at TF H4..

Ignored

Thanks for sharing fishing....does it means bull is on bias?
May God blessing all of you!
 
 
  • Post #7,774
  • Quote
  • Feb 21, 2008 3:14am Feb 21, 2008 3:14am
  •  Malaysia
  • Joined Oct 2007 | Status: Member | 6,522 Posts
Quoting fising
Disliked
hi ff.alexyong..just wanna share..with u ,,,my personal preview...at TF H4..

Ignored
I hope you don't mind if I do commentary on your chart. I did some editing to your chart.

As I can see... there's possible FALSE SIGNAL as well... look at the Price Action previously comparing it with the SIGNAL from QQE and MACD.... However, If that QQE H4 really crossing strong... I am up for long term LONG on Geppy.

Tricky isn't it? Trading FOREX is not as easy as A B C
Attached Image (click to enlarge)
Click to Enlarge

Name: chart790.PNG
Size: 286 KB
 
 
  • Post #7,775
  • Quote
  • Feb 21, 2008 3:20am Feb 21, 2008 3:20am
  •  ff.alexyong
  • | Joined Dec 2007 | Status: Saturn | 44 Posts
Quoting Malaysia
Disliked
I hope you don't mind if I do commentary on your chart. I did some editing to your chart.

As I can see... there's possible FALSE SIGNAL as well... look at the Price Action previously comparing it with the SIGNAL from QQE and MACD.... However, If that QQE H4 really crossing strong... I am up for long term LONG on Geppy.

Tricky isn't it? Trading FOREX is not as easy as A B C
Ignored
Ya, I agree with Sham. Recently, i am quite focus using QQE together with Stoch. I found that QQE signal produce stronger confirmation than Stoch in terms of H1 and H4 chart. I sometimes also depends on QQE on M5 to entry and exit as well.
Sham, are you using QQE for entry and exit also?
May God blessing all of you!
 
 
  • Post #7,776
  • Quote
  • Feb 21, 2008 3:27am Feb 21, 2008 3:27am
  •  karimaero
  • | Joined Dec 2007 | Status: Newbie From Melaka | 36 Posts
Quoting savant
Disliked
Seems like everyone is favoring bull.

Set the SL in ... sit back and relax. Good luck !
Ignored
Not everyone..... i am still in for a teddy bear....
 
 
  • Post #7,777
  • Quote
  • Feb 21, 2008 3:28am Feb 21, 2008 3:28am
  •  fising
  • Joined Nov 2007 | Status: Member | 1,158 Posts
Quoting Malaysia
Disliked
I hope you don't mind if I do commentary on your chart. I did some editing to your chart.

As I can see... there's possible FALSE SIGNAL as well... look at the Price Action previously comparing it with the SIGNAL from QQE and MACD.... However, If that QQE H4 really crossing strong... I am up for long term LONG on Geppy.

Tricky isn't it? Trading FOREX is not as easy as A B C
Ignored
thanks for your advise...my friend.. maybe,,, there's possible false signal as well.. but i'm not use 'macd'... above... indicator QQE is Stochistrogram.....for me...QQE not cross strong bull now...if break price 210.91 ..maybe a good resistance...area...bro.if u see.i use my SL at 209.70...i always accept my loss bro.....still learn...
 
 
  • Post #7,778
  • Quote
  • Feb 21, 2008 3:30am Feb 21, 2008 3:30am
  •  Malaysia
  • Joined Oct 2007 | Status: Member | 6,522 Posts
Quoting ff.alexyong
Disliked
Ya, I agree with Sham. Recently, i am quite focus using QQE together with Stoch. I found that QQE signal produce stronger confirmation than Stoch in terms of H1 and H4 chart. I sometimes also depends on QQE on M5 to entry and exit as well.
Sham, are you using QQE for entry and exit also?
Ignored

My ENTRY and EXIT mainly depends on PRICE ACTION and Candle Stick formation and most of the time depending on PRICE BREAKOUT certain Trendline/ Triangle/ Pivot Point/ Channel... I normally Check all time frame before Execute the Order. I also keep my eyes on the Market Psychology at certain Moving Average.

Those Indis... such as QQE ... STOCH ... MACD ... RSI are just as my extra guideline or conformation before making the real DECISION.
 
 
  • Post #7,779
  • Quote
  • Feb 21, 2008 3:35am Feb 21, 2008 3:35am
  •  Malaysia
  • Joined Oct 2007 | Status: Member | 6,522 Posts
Quoting fising
Disliked
thanks for your advise...my friend.. maybe,,, there's possible false signal as well.. but i'm not use 'macd'... above... indicator QQE is Stochistrogram.....for me...QQE not cross strong bull now...if break price 210.91 ..maybe a good resistance...area...bro.if u see.i use my SL at 209.70...i always accept my loss bro.....still learn...
Ignored
Oh ... my bad No wonder I saw something strange and weird on that MACD... I thought it was Custom Made MACD... I was wrong... It was actually STOCHISTOGRAM... I have no idea what it is
 
 
  • Post #7,780
  • Quote
  • Feb 21, 2008 3:37am Feb 21, 2008 3:37am
  •  fising
  • Joined Nov 2007 | Status: Member | 1,158 Posts
my dream......
Attached Image
 
 
  • Interactive Trading
  • /
  • Malaysia
  • Reply to Thread
    • 1 387388Page 389390391 1224
    • 1 Page 389 1224
0 traders viewing now
  • More
Top of Page
  • Facebook
  • Twitter
About FF
  • Mission
  • Products
  • User Guide
  • Media Kit
  • Blog
  • Contact
FF Products
  • Forums
  • Trades
  • Calendar
  • News
  • Market
  • Brokers
  • Trade Explorer
FF Website
  • Homepage
  • Search
  • Members
  • Report a Bug
Follow FF
  • Facebook
  • Twitter

FF Sister Sites:

  • Metals Mine
  • Energy EXCH
  • Crypto Craft

Forex Factory® is a brand of Fair Economy, Inc.

Terms of Service / ©2023