• Home
  • Forums
  • Trades
  • News
  • Calendar
  • Market
  • Brokers
  • Login
  • Join
  • User/Email: Password:
  • 10:16am
Menu
  • Forums
  • Trades
  • News
  • Calendar
  • Market
  • Brokers
  • Login
  • Join
  • 10:16am
Sister Sites
  • Metals Mine
  • Energy EXCH
  • Crypto Craft

Options

Bookmark Thread

First Page First Unread Last Page Last Post

Print Thread

Similar Threads

COT trading system with free indicator 297 replies

No Free Lunch but all the Free Coffee you can drink 736 replies

SWAP free, rollover free Broker? 15 replies

How to free indicator resources? indicator called from EA 6 replies

  • Commercial Content
  • /
  • Reply to Thread
  • Subscribe
  • 2,289
Attachments: Indicator Free Trading - Skunny
Exit Attachments
Tags: Indicator Free Trading - Skunny
Cancel

Indicator Free Trading - Skunny

  • Last Post
  •  
  • 1 189190Page 191192193 424
  • 1 Page 191 424
  •  
  • Post #3,801
  • Quote
  • Feb 13, 2008 3:05pm Feb 13, 2008 3:05pm
  •  arralou
  • | Joined Dec 2007 | Status: Member | 30 Posts
Back to the basics!

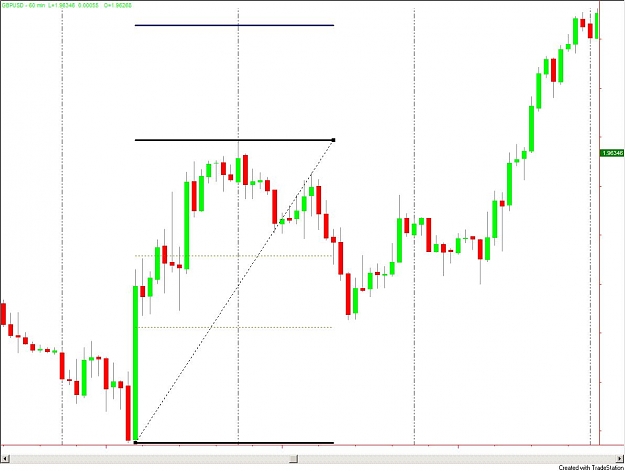
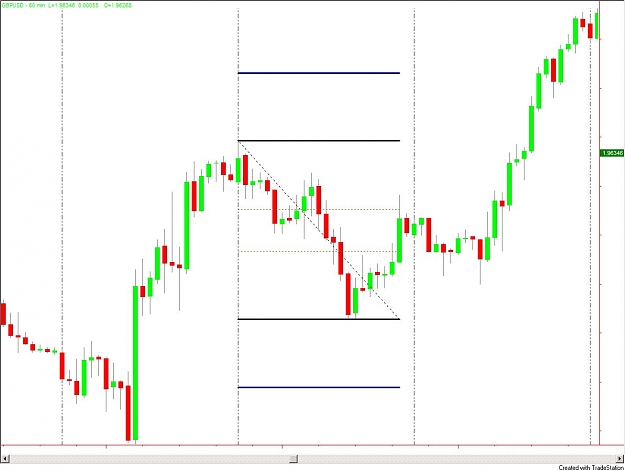
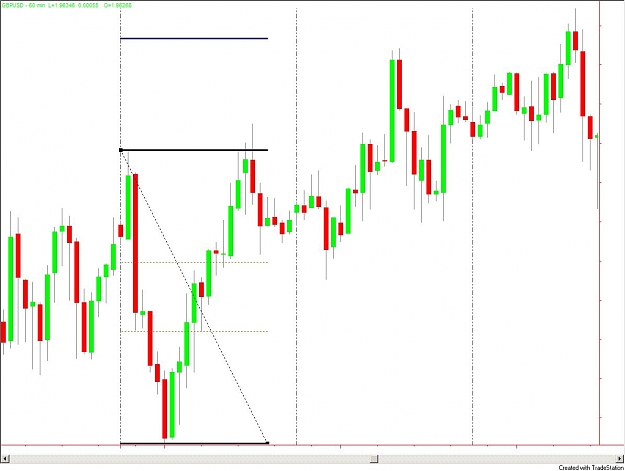
My choice of colors are never the best, and I will probably never be a fashion expert. Hope it doesn't look to cluttered. I have used big bold, blue lines to show you where my fibs were drawn. See how price reacted to the 138.2%.

Jon
Attached Image(s) (click to enlarge)
Click to Enlarge

Name: gbpusd2-1.gif
Size: 35 KB
Click to Enlarge

Name: gbpusd2-2suksess.gif
Size: 34 KB
Do what thou wilt shall be the whole of the law.
 
 
  • Post #3,802
  • Quote
  • Feb 13, 2008 5:20pm Feb 13, 2008 5:20pm
  •  SteveHopwood
  • | Commercial Member | Joined Apr 2007 | 8,331 Posts
The NicoTina strategy is a breakout gj; usual stuff - a range is calculated at such a time and pending orders are placed; 100 pip sl and tp etc.

All this takes place when I am still in bed, so there is an ea that handles the trades. Often, these trades have run their course by the time I get up, but not this morning.

The trade (a sell) was about +20 when I looked so I fibbed the larger swing, then the smaller swing I would be looking to trade. The market price had already breeched the sell level and marched down to touch target 1 (-1.382), so I closed the trade and took the profits.

Gj rose about 190 points today. From its low when I spotted the ea trade, it has risen just short of 300, so a trade that would have been a loss of 1% of the account if left to its own devices, turned into a tiny profit.

Nice one, fibo. Good doggie. Nice one Skunny. Nice....um.....fibber?


  • Post #3,803
  • Quote
  • Feb 13, 2008 8:20pm Feb 13, 2008 8:20pm
  •  DXTrade
  • Joined Jul 2007 | Status: Take Five | 755 Posts
Quoting bergwagter
Disliked
Hi DXTrade

This thread is growing so fast, if you do not read new posts for a few days it takes you a week to get up to date. Getting down to what we're busy with ... What tickled me in the back of my head was how to tie cycles with the examples Skunny gave on carrying forward S/R from previous down/up trends to later up/down trends (can't remember the post no. but I remember supports being important in up trends and visa versa). Maybe someone have cracked Skunny's Riddle in post # 137 (if so i've missed it - sorry then) ... isn't this (your example above) exactly the answer to Skunny's riddle ... see chart. The fib was drawn between 2 support levels as the market was going long ....
Ignored
That's pretty much the essence of what I was talking about... yes.
Below is the continuation of the fib drawn on S/R levels from yesterday:
Attached Image (click to enlarge)
Click to Enlarge

Name: demonstration.gif
Size: 18 KB
"The only successful substitute for brains is silence."
 
 
  • Post #3,804
  • Quote
  • Edited 11:46pm Feb 13, 2008 8:23pm | Edited 11:46pm
  •  DXTrade
  • Joined Jul 2007 | Status: Take Five | 755 Posts
And here a back to the roots update of my indicator.
I removed the gann lines and added the AL zone...
and added the previous week levels...
Thats enough to trade together with the fib tool Clean and easy
Attached Image (click to enlarge)
Click to Enlarge

Name: gj.gif
Size: 15 KB
Attached File(s)
File Type: ex4 DXTrade Daily Boxed Fibs&Pivots.ex4   18 KB | 724 downloads
"The only successful substitute for brains is silence."
 
 
  • Post #3,805
  • Quote
  • Feb 13, 2008 8:28pm Feb 13, 2008 8:28pm
  •  sizzler
  • | Joined Dec 2007 | Status: Member | 392 Posts
Croatoan LOL


Sizz.
 
 
  • Post #3,806
  • Quote
  • Feb 13, 2008 8:41pm Feb 13, 2008 8:41pm
  •  SBrickman
  • | Membership Revoked | Joined Aug 2007 | 240 Posts
Quoting Brunite
Disliked
SB,

I don't think anyone is telling you to "go away".

It's just that I don't think you've ever explained what all the "stuff" on your charts means.......negating any benefit it might offer to others. If you've got something that is working....GREAT!

Just not sure why you are posting these colorful charts without any explanation whatsoever.....they aren't typical "Skunnyish" charts that most would understand. Those that are throwing up additional things like Gann angles or Fib Channels are at least giving some explanation to the group on what they are doing.

I think this was DaGood's point......
Ignored
The explanation is simple... the salmon dots are the fib projections. If you notice where the price extends to after breaking support or resistance and look to the left, you'll see salmon dots at that level - THOSE DOTS PREDICTED THE PRICE.
Attached Image (click to enlarge)
Click to Enlarge

Name: usdjpy_20080213b.gif
Size: 61 KB
 
 
  • Post #3,807
  • Quote
  • Feb 13, 2008 11:57pm Feb 13, 2008 11:57pm
  •  trader416
  • | Joined Oct 2005 | Status: Member | 63 Posts
Two things have been bothering me. I'll post them in 2 seperate posts to keep from getting confusing. Question #1: On the first chart below, the fib might not been drawn in the right place, but let's assume it is. As price retraces, it forms another swing low support.

But then, Skunny says "make sure you fib the closest resistance as the high if you are going short and the closest support if you go long". If I were to take him literally, then should I abandon the first fib, and re-draw the fib like in the 2nd chart (since the former support is no longer the closest support) ?


If so, do I keep abandoning fibs as new S/R forms ?? .......but then my fibs would get smaller and smaller because of all the retracements, in this case, until it's no longer worth trading.
Attached Image(s) (click to enlarge)
Click to Enlarge

Name: Pic1.jpg
Size: 79 KB
Click to Enlarge

Name: Pic2.jpg
Size: 77 KB
 
 
  • Post #3,808
  • Quote
  • Feb 14, 2008 12:05am Feb 14, 2008 12:05am
  •  trader416
  • | Joined Oct 2005 | Status: Member | 63 Posts
My second problem is similar: In the first chart below, price has broken the top of my fib, so I should be Long. Price then retraces, and forms a new swing low support.

My question is: Do I keep my target as the 138 of my original fib, or do I move the fib up to the new support (like in the 2nd chart), and revise my target to the new 138 ? I realize that both targets would have been hit eventually, but I'd like to know which one is the proper target to aim for ?

Any thoughts ?
Attached Image(s) (click to enlarge)
Click to Enlarge

Name: Pic3.jpg
Size: 85 KB
Click to Enlarge

Name: Pic4.jpg
Size: 84 KB
 
 
  • Post #3,809
  • Quote
  • Feb 14, 2008 12:07am Feb 14, 2008 12:07am
  •  DXTrade
  • Joined Jul 2007 | Status: Take Five | 755 Posts
Quoting trader416
Disliked
Two things have been bothering me. I'll post them in 2 seperate posts to keep from getting confusing. Question #1: On the first chart below, the fib might not been drawn in the right place, but let's assume it is. As price retraces, it forms another swing low support.

But then, Skunny says "make sure you fib the closest resistance as the high if you are going short and the closest support if you go long". If I were to take him literally, then should I abandon the first fib, and re-draw the fib like in the 2nd chart (since the former support is no longer the closest support) ?


If so, do I keep abandoning fibs as new S/R forms ?? .......but then my fibs would get smaller and smaller because of all the retracements, in this case, until it's no longer worth trading.
Ignored
I would add both fibs. One is a swing fib, the other a retrace fib.

First the left one... then the next one as soon as there is a noticable retrace... enter in the easter egg area and exit progressively at each TP with parts of my position.

But thats just me...
Attached Image (click to enlarge)
Click to Enlarge

Name: gj.gif
Size: 19 KB
"The only successful substitute for brains is silence."
 
 
  • Post #3,810
  • Quote
  • Feb 14, 2008 12:10am Feb 14, 2008 12:10am
  •  piphitman
  • | Joined Oct 2007 | Status: Member | 439 Posts
I was just going to say the same thing DX re: Q#1

place two fibs, one major one for most recent swing high and the other a retracement fib.

trader416, have you read any of Bobokus' thread? it's all in there.
trading naked.......
 
 
  • Post #3,811
  • Quote
  • Feb 14, 2008 12:33am Feb 14, 2008 12:33am
  •  trader416
  • | Joined Oct 2005 | Status: Member | 63 Posts
Quoting piphitman
Disliked
trader416, have you read any of Bobokus' thread? it's all in there.
Ignored
I have to admit I haven't, because I've only just finished reading this thread yesterday. However, others have said here several times that everything we need is in this thread. In any case, my question relates more to interpreting what Skunny said, rather than how to draw fibs. Thanks for the feedback so far from you and DXTrade.
 
 
  • Post #3,812
  • Quote
  • Feb 14, 2008 1:39am Feb 14, 2008 1:39am
  •  trader1234
  • Joined Jun 2006 | Status: Member | 107 Posts
I agree with dxtrade using the 2 fibs together. That's the way i trade as well.

And it's all there in bo's thread. Very in-depth teachings. Great.
 
 
  • Post #3,813
  • Quote
  • Feb 14, 2008 1:39am Feb 14, 2008 1:39am
  •  PiPr Pro
  • | Joined Nov 2006 | Status: Member | 312 Posts
Quoting trader416
Disliked
I have to admit I haven't, because I've only just finished reading this thread yesterday. However, others have said here several times that everything we need is in this thread. In any case, my question relates more to interpreting what Skunny said, rather than how to draw fibs. Thanks for the feedback so far from you and DXTrade.
Ignored
its a 2 edged sword - bo gives fantastic analysis, but skunny said Bo is not teaching skunny's way of trading. But you will learn an incredible amount with Bo's direct way of analysis each day also.
 
 
  • Post #3,814
  • Quote
  • Feb 14, 2008 3:15am Feb 14, 2008 3:15am
  •  DXTrade
  • Joined Jul 2007 | Status: Take Five | 755 Posts
Not too bad for a fib drawn in the middle of nowhere on an old S/R level
Attached Image (click to enlarge)
Click to Enlarge

Name: gj.gif
Size: 18 KB
"The only successful substitute for brains is silence."
 
 
  • Post #3,815
  • Quote
  • Feb 14, 2008 6:09am Feb 14, 2008 6:09am
  •  nikkipip4
  • | Joined Jul 2007 | Status: Member | 70 Posts
In post 3704 Baspips reiterated one of Skunny's posts about fibbing the daily so here is my chart on the EUR/USD. After fibbelizing every daily candle. The only one up to the 8th of Feb. that still hasn't completed it's 138 or 162 cycle. Am I correct in saying if it breaks the 1.4651 and holds it will surely go to 1.4732 or 1.4784 eventually. A safe entry would be a break and hold of the 100 with a stop below the fibbed candle. Am I correct in this assumption or am I still way off base. Man it has taken a long time for my thick head to absorb all of this and get away from my indis. Please critique, all of you that get it or anyone at all! LOL Thank you.

Nikki
Attached Image (click to enlarge)
Click to Enlarge

Name: charteur.gif
Size: 11 KB
 
 
  • Post #3,816
  • Quote
  • Feb 14, 2008 6:15am Feb 14, 2008 6:15am
  •  DXTrade
  • Joined Jul 2007 | Status: Take Five | 755 Posts
Quoting nikkipip4
Disliked
In post 3704 Baspips reiterated one of Skunny's posts about fibbing the daily so here is my chart on the EUR/USD. After fibbelizing every daily candle. The only one up to the 8th of Feb. that still hasn't completed it's 138 or 162 cycle. Am I correct in saying if it breaks the 1.4651 and holds it will surely go to 1.4732 or 1.4784 eventually. A safe entry would be a break and hold of the 100 with a stop below the fibbed candle. Am I correct in this assumption or am I still way off base. Man it has taken a long time for my thick head to absorb all of this and get away from my indis. Please critique, all of you that get it or anyone at all! LOL Thank you.

Nikki
Ignored
There is no "sure" in forex, but your assumption is more or less ok.
What I would do is draw another fib from the high in the 1.49 area to the low of your fib, and see whether the actual uptrend is a retracement... to maybe see where it might stop to resume the big down move if the price starts bouncig off of one of the inner levels..

But what do I know
"The only successful substitute for brains is silence."
 
 
  • Post #3,817
  • Quote
  • Feb 14, 2008 6:19am Feb 14, 2008 6:19am
  •  dagoods
  • Joined Nov 2007 | Status: Member | 3,039 Posts
Quoting nikkipip4
Disliked
In post 3704 Baspips reiterated one of Skunny's posts about fibbing the daily so here is my chart on the EUR/USD. After fibbelizing every daily candle. The only one up to the 8th of Feb. that still hasn't completed it's 138 or 162 cycle. Am I correct in saying if it breaks the 1.4651 and holds it will surely go to 1.4732 or 1.4784 eventually. A safe entry would be a break and hold of the 100 with a stop below the fibbed candle. Am I correct in this assumption or am I still way off base. Man it has taken a long time for my thick head to absorb all of this and get away from my indis. Please critique, all of you that get it or anyone at all! LOL Thank you.

Nikki
Ignored

are u close.... uh... yes i would say u r close...like horshoes hangrenade close defineitely yes...if u mean r u close to bagging a moley quail then no...lol


the exercise skunny gave us in the very beginiing of the thread was to fib weekly candles and see what happened when there was a penetration and then break.... someone even put down stats at one point in an early post like x went to 138 and y didnt or something like that... i dont remember exactly... but u r getting the idea..... this is the first step IMO but skunny also warned us not to trade it..and to just do the exercise on vhands..... so maybe u should practice on vhands and then go back and keep reading the trhead and taking the thread in pieces like we all did as it was happening...slow is better sometimes IMO....demo like me for a while.....I beleive skunny said when we demo 90% then we are ready to start trading ..or maybe he said 9 of 10 per week wins ... i forget exactly..... but the point was to practice... and take 1 step at a time... u have only begun to take step 1 based on what u r asking here...on fibbing candles and watching what happens.... I'm not sure if there are any short cuts .... for me 1 step at a time and lots and lots and lots and lot s of vhands.....

hope this helps
 
 
  • Post #3,818
  • Quote
  • Feb 14, 2008 7:02am Feb 14, 2008 7:02am
  •  nikkipip4
  • | Joined Jul 2007 | Status: Member | 70 Posts
Quoting DXTrade
Disliked
OK... here my first more elaborated example.
I draw some more accurate S/R lines... pulled them to today and just draw a fib or 2.
As you can see.. the right fib went out fine for about 120 pips today. I could have drawn the swing as well with approximately the same extension ( the second fib from the right) but I would never ever have drawn a fib there... ever. Maybe thats why Skunny has his fibs on some places where I just couldn't understand why.
I hope someone is seeing the point

Good night...
Ignored
Thank you DXTRADE for the insight. I have been looking mostly at S/R for the places to draw fibs but could never fully be sure if they were the right ones. I would place them at change of direction and realize Skunny picked an entire different one than I would have and for what reason??? I was always taught s/r points were where price had a tough time getting through, but that doesn't seem to be right in this case. Any further enlightenment would be so appreciated as just drawing fibs on the hi and lo has not been really working all the time.
Also thank you to ALL of you for all the help and sharing. Love to read all the interesting ideas.
Nikki
 
 
  • Post #3,819
  • Quote
  • Feb 14, 2008 7:19am Feb 14, 2008 7:19am
  •  nikkipip4
  • | Joined Jul 2007 | Status: Member | 70 Posts
Quoting DXTrade
Disliked
There is no "sure" in forex, but your assumption is more or less ok.
What I would do is draw another fib from the high in the 1.49 area to the low of your fib, and see whether the actual uptrend is a retracement... to maybe see where it might stop to resume the big down move if the price starts bouncig off of one of the inner levels..

But what do I know
Ignored
Hey man you know a bunch thanks for the help!! Checks in the mail! LOL!!
 
 
  • Post #3,820
  • Quote
  • Feb 14, 2008 7:26am Feb 14, 2008 7:26am
  •  nikkipip4
  • | Joined Jul 2007 | Status: Member | 70 Posts
Quoting DXTrade
Disliked
There is no "sure" in forex, but your assumption is more or less ok.
What I would do is draw another fib from the high in the 1.49 area to the low of your fib, and see whether the actual uptrend is a retracement... to maybe see where it might stop to resume the big down move if the price starts bouncig off of one of the inner levels..

But what do I know
Ignored
Now that I have fibbed the 149 area I come up with a hit directly on the 38.2 so that means it may be a retracement? How do I know that for sure? is it just if it keeps going down? Sorry for all the dumb ?? Thank you.
 
 
  • Commercial Content
  • /
  • Indicator Free Trading - Skunny
  • Reply to Thread
    • 1 189190Page 191192193 424
    • 1 Page 191 424
0 traders viewing now
  • More
Top of Page
  • Facebook
  • Twitter
About FF
  • Mission
  • Products
  • User Guide
  • Media Kit
  • Blog
  • Contact
FF Products
  • Forums
  • Trades
  • Calendar
  • News
  • Market
  • Brokers
  • Trade Explorer
FF Website
  • Homepage
  • Search
  • Members
  • Report a Bug
Follow FF
  • Facebook
  • Twitter

FF Sister Sites:

  • Metals Mine
  • Energy EXCH
  • Crypto Craft

Forex Factory® is a brand of Fair Economy, Inc.

Terms of Service / ©2023