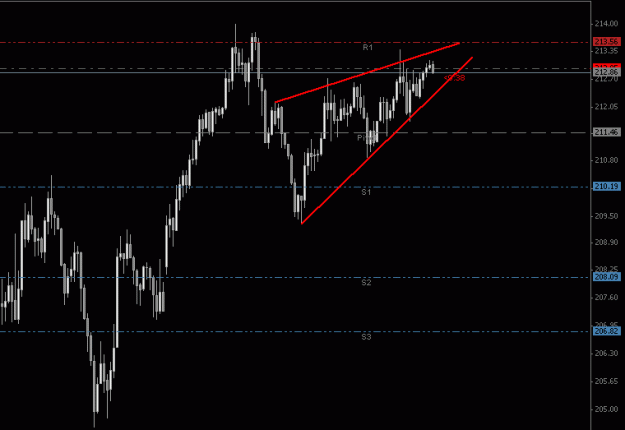
Hi nasi lemak, so earlier! I wouldnt have wake up if not for my kid . : Well, since i already up, i might as well have a look on today's GJ chart. Triple interest wednesday , swap taking day, we will c more action today, profit making or maybe lose more. Today we might c a bull GJ again as more ppl will opt for long, but i wouldnt bet on big bull, i think it will consolidate around area 213.50-213.90. Chances of going down 209.00 area is very high.
Hi nasi lemak, so earlier! I wouldnt have wake up if not for my kid . : Well, since i already up, i might as well have a look on today's GJ chart. Triple interest wednesday , swap taking day, we will c more action today, profit making or maybe lose more. Today we might c a bull GJ again as more ppl will opt for long, but i wouldnt bet on big bull, i think it will consolidate around area 213.50-213.90. Chances of going down 209.00 area is very high.
Ignored
hehe.. wake up early so we can get extra luck! :
thanks for your comment savant. hopefully we can ride for the big bear for today? uhuhh..
orite.. gtg for nasi lemak.. my 'perut' is already making noise
see ya later guys~
Hi Savant i've downloaded your auto pivot indicator but still having problem to copy and paste it on metatrader chart.Could you help me?Thanks..
Ignored
Good morning Wakli. Regrading your problem, 1st of all, have u copy n paste it in your metatrader/expert/indicators folder? 2nd ,make sure u close your metatrader and re-open it to enable the indicator to work. 3rd, by changing the time frame in your chart will activate the auto pivot. Let me know if u still have problem. I will test out the indicator again.
Hi Savant,
I have been following every of your posts especially the pivot that you always give.I use it to compare mine and i must say it been great using PP with you.You actually encourage me to start using it.
So pls i always want to know your next move:whether to S OR R.
Thanks.http://forexfactory.com/images/icons/icon14.gif
Ignored
TQ TQ, sometimes i dont give out all the R n S, because i feel some r too far target n hope you understand what i mean. Anyway TQ again.
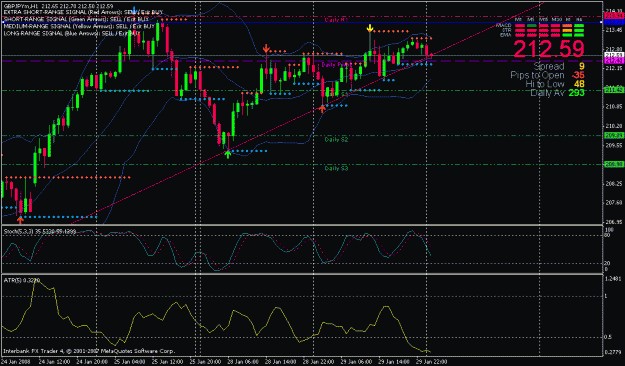
Seems very quiet @ the market. EU didn't move much yesterday. Ranging between 1.4797 and 1.4735. Around 62 PIPS. Seems like everybody waiting for the Fed rate cut today. Most news said that this pair will go south today.
I m following Savant's trade GJ. But my pivot is different.
Seems very quiet @ the market. EU didn't move much yesterday. Ranging between 1.4797 and 1.4735. Around 62 PIPS. Seems like everybody waiting for the Fed rate cut today. Most news said that this pair will go south today.
I m following Savant's trade GJ. But my pivot is different.
The day still young ... Br0... wait till it break pivot ... then we'll see some bright light ... My entry at 212.75 after rebounce from crossing ... just neat.. but not better compare to ya Br0 ...
the drawing of the triangle just does not seem right, just a feeling. it is a short term uptrend and down a little bit. so shouldnt we start from the start of the top rally, connecting all the tops and all the lows to form a trianglemaybe draw too soon? anyway, triangle is one of the most common patterns and normally considered as least reliable because it can be signal continuing of trend and can be reversal. the furthest a triangle can break away, maybe one half or 2/3 of the distance of the top (start/highest) to its bottom (apex). failure of significant break will make it a horizontal consolidation. maybe you can draw a line (similar with your wedge top line), make it a channel if break maybe worthwhile targeting the bottom channel. but i think maybe too soon to draw a triangle. maybe i am wrong.
the drawing of the triangle just does not seem right, just a feeling. it is a short term uptrend and down a little bit. so shouldnt we start from the start of the top rally, connecting all the tops and all the lows to form a trianglemaybe draw too soon? anyway, triangle is one of the most common patterns and normally considered as least reliable because it can be signal continuing of trend and can be reversal. the furthest a triangle can break away, maybe one half or 2/3 of the distance of the top (start/highest) to its bottom (apex). failure of significant break will make it a horizontal consolidation. maybe you can draw a line (similar with your wedge bottom line), make it a channel if break maybe worthwhile targeting the upper channel . but i think maybe too soon to draw a triangle. maybe i am wrong.
Just a view.
Ignored
sorry, after re-think, i made a correction. maybe i am wrong again. get myself confuse
sorry, after re-think, i made a correction. maybe i am wrong again. get myself confuse
Ignored
hm.. actually im very weak at recognizing patterns. but still learning and keep learning.
as i can see from your previous posts, it looks like you have better understanding in patterns and all that. i hope i can learn more from u . thanks for commenting abt the chart i posted earlier.
Hi and welcome ZA_XC03. What a name! Anyway ,what i can say is there is really no best indicators, there r only indicators that u used often and get use to them, so practice makes perfect. Try using simple indicators like RSI, CCI, Stoch or Momentum which all are available n come with your metatrader. Im sure many other members here can help you out too. Dont worry, keep asking anything u want, we will be glad to help u.
Ignored
Thank you for your reply ..... but all indicator is lagging that can make me late to enter market and i can lost some of my money .....do you thing trend line is the best of TA to measure market strength
Thank you for your reply ..... but all indicator is lagging that can make me late to enter market and i can lost some of my money .....do you thing trend line is the best of TA to measure market strength
Ignored
Yes , trend line can be one of the best tool but there is no 100% way of drawing a perfect trendline, where we still have to rely on simple indicators like Stoch, RSI. When combining them, we would get better result.
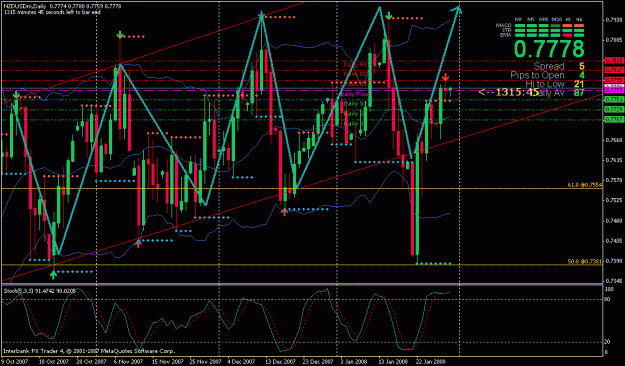
hehe savant my friend, i already pick a nzdusd long yesterday and still holding it. but still not moving much.
Ignored
Yeah, wont c much movement in NU, its one of the least volatile , so thats why im trading the most n least volatile together. Anyway ,got to becareful when NU reach 0.8000, they seldom go over that point and NZ gov mostly will hold back the raise of their currency.
Chance for NU to hit 0.7550 range b4 heading upward again. Good luck