What type of information we are looking from the mixed signals? Does it mean the current trend is weakening? Please provide some more details about how to use this as a filter or anticipate new signals. I will post a two color histogram indicator tomorrow that will show which is dominating (+DI or -DI).
BTW, which indicator is producing the arrows in your chart?
Regards,
chandra
Ignored
Hi chandra,
is there a way you can make those lag 1 and lag 2 files for esignal ? i would love to use them on my esignals too if possible ..
This plots the difference between the +DI and -DI as Histogram. The color clearly shows who is dominating (bulls or bears; The resulting direction is exactly same as adding Bulls_Power+Bears_Power, even though the values will be different).
Input Parameter details:
ADXDI_Bars = 14 (number of bars for ADX/DMI calculation).
MA_Period1 = 1 (for Moving Average of this difference; shown by a blue line).
Min_Difference = 5 (minimum difference to plot the histogram; if less, histogram will not be shown for that bar; filters out weak moves).
Min_DI_Level = 20 (minimum value at least one of the +DI or -DI must have; if less, histogram will not be shown for that bar; filters out weak moves).
Hi chandra,
is there a way you can make those lag 1 and lag 2 files for esignal ? i would love to use them on my esignals too if possible ..
Thanks,
Goodbadmas
Ignored
I think you can get it from esignal website. Try the following link or search there (or contact Support). But it will not have the MA-smoothed Lag, just simple version. You can ask the Support there about whether you can add MA smoothing.
This plots the difference between the +DI and -DI as Histogram. The color clearly shows who is dominating (bulls or bears; The resulting direction is exactly same as adding Bulls_Power+Bears_Power, even though the values will be different).
Input Parameter details:
ADXDI_Bars = 14 (number of bars for ADX/DMI calculation).
MA_Period1 = 1 (for Moving Average of this difference; shown by a blue line).
Min_Difference = 5 (minimum difference to plot the histogram; if less, histogram will not be shown for that bar; filters out weak moves).
Min_DI_Level = 20 (minimum value at least one of the +DI or -DI must have; if less, histogram will not be shown for that bar; filters out weak moves).
I hope people find it useful.
Regards,
chandra
Ignored
hi chandra,
thanks for the info .. i will find about from esignal suport about the lags .. about this adxdi . is this the best setting or just default and we can change it around ? do u recommend the setting that u have in there ??
hi chandra,
about this adxdi . is this the best setting or just default and we can change it around ? do u recommend the setting that u have in there ??
thanks,
goodbadmas
Ignored
The settings are reasonably good for 15M and above (I have not checked in lower TF). The default 14 Bar data was choppy often. The last two filters I added only today and have not checked them much. But looked like they were reducing a lot of choppiness. You have to wait for the bar to close. Also, the signal bar range must be broken (this I like for every method).
The settings are reasonably good for 15M and above (I have not checked in lower TF). The default 14 Bar data was choppy often. The last two filters I added only today and have not checked them much. But looked like they were reducing a lot of choppiness. You have to wait for the bar to close. Also, the signal bar range must be broken (this I like for every method).
chandra
Ignored
Chandra, nice work.
I appreciate the time you have taken to create this.
I have attached a screenshot. At the bottom is your indicator. I have changed the histogram bars to white (invisible) and left visible is the blue MA.
Is there a way to just have a "raw" difference indicator? If the DI+ is above DI- then the line is always above the zero level and vice-versa with no MA filter.
From there we can add a "filter level line" above and below the zero line.
Thanks once again.
Kindest regards,
Damo12
Kindest regards, D
Ignored
hi Damo12,can u pls provide us with your ADX DI indicator? thanks
I appreciate the time you have taken to create this.
I have attached a screenshot. At the bottom is your indicator. I have changed the histogram bars to white (invisible) and left visible is the blue MA.
Is there a way to just have a "raw" difference indicator? If the DI+ is above DI- then the line is always above the zero level and vice-versa with no MA filter.
From there we can add a "filter level line" above and below the zero line.
Thanks once again.
Kindest regards,
Damo12
Ignored
Hi Damo,
The blue line is the raw difference, when MA=1 is used (which is default). When filter values are set to zero (for last two parameters), the Histogram also will be raw difference in color. When +DI is above -DI, blue line and histogram will be above zero (and when +DI is below -DI, they will be below zero). Blue line is not filtered by any of the controls (the controls affect only the histogram). I have left default filter level lines at +8 and -8 which I thought was good (long ago).
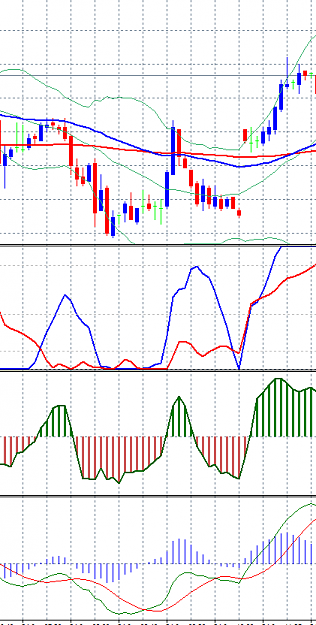
Check this out, I have mixed signals too. I notice that the 38.2(207.06) was becuming a good retracment support.Although, I did not re-enter this trade.
-Pipimintpati
- I red area is the approximate time of when There is an over lap in the Europipian and the us Session's. I see alot of wipsaw action during these times, but, usually with more reliable signals. People were probably trading this on a short TF and expected less of a retracment???
-What do you all think?
Ignored
I don't know the indicator "QQE". Would you let me know the text formula
please - maybe I get it coded for my software?
hi to all
thank you for this setup i have beaning using it for about 3 weeks and it has beaning working 50% of the time for me . can some one tell me what does the ema 200 and ema60 do for me i am shore how i am not shore how i need to used them .
i really like your trading system and i appreciate you giving it out for newbies like me to use for free.
I have a complain to make though. I noticed your LISPA1A signal is very inconsistent with your indicators. Which carries more weight? the LISPA1A signal or your trading system indicators which r macd,lag1 &lag2, stoch histogram and ur emas.
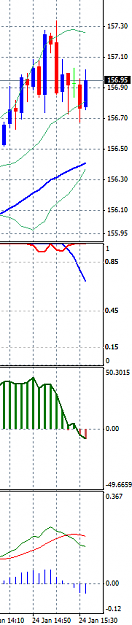
Has anyone had good signals since about 8PM EST 1/23? The blue Laguerre line has dropped from the top and below .85, goes below .45 then back up. I've seen this on several pairs (GBPUSD, EURJPY, GBPJPY, USDJPY). Other pairs are just jumbled.
I keep getting stopped out on this setup. By the time a signal is given, the pair has already slid down a good bit. This leaves just enough room for it to climb back up and stop you out. I'm using a 20 SL + spread.
Entered sell for EURJPY @ 156.81. Stopped out @ 157.06.
I keep getting stopped out on this setup. By the time a signal is given, the pair has already slid down a good bit. This leaves just enough room for it to climb back up and stop you out. I'm using a 20 SL + spread.
Entered sell for EURJPY @ 156.81. Stopped out @ 157.06.
Ignored
I wouldn't trade this system... or any other before or after a tier one news release.
I'd wait a good hour if not more before taking a position.