• Home
  • Forums
  • Trades
  • News
  • Calendar
  • Market
  • Brokers
  • Login
  • Join
  • 4:42am
Menu
  • Forums
  • Trades
  • News
  • Calendar
  • Market
  • Brokers
  • Login
  • Join
  • 4:42am
Sister Sites
  • Metals Mine
  • Energy EXCH
  • Crypto Craft

Options

Bookmark Thread

First Page First Unread Last Page Last Post

Print Thread

Similar Threads

Broker Challenge "NDD/STP" vs. True "ECN" and "Mkt Mkr" broker talk 46 replies

You talk the talk I walk the talk 8 replies

Lets talk USDCAD 295 replies

geppy is "ugly" when ? 14 replies

Lets Talk Support and Resistance 13 replies

  • Interactive Trading
  • /
  • Reply to Thread
  • Subscribe
  • 58
Attachments: Lets Talk GBP/JPY "the geppy"
Exit Attachments
Tags: Lets Talk GBP/JPY "the geppy"
Cancel

Lets Talk GBP/JPY "the geppy"

  • Last Post
  •  
  • 1 23Page 456 8
  • 1 3Page 45 8
  •  
  • Post #61
  • Quote
  • Sep 21, 2007 5:51pm Sep 21, 2007 5:51pm
  •  BurgerKing
  • Joined Jul 2006 | Status: Member | 2,924 Posts
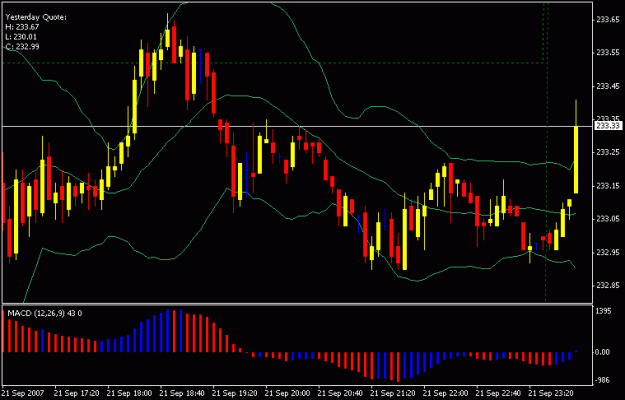
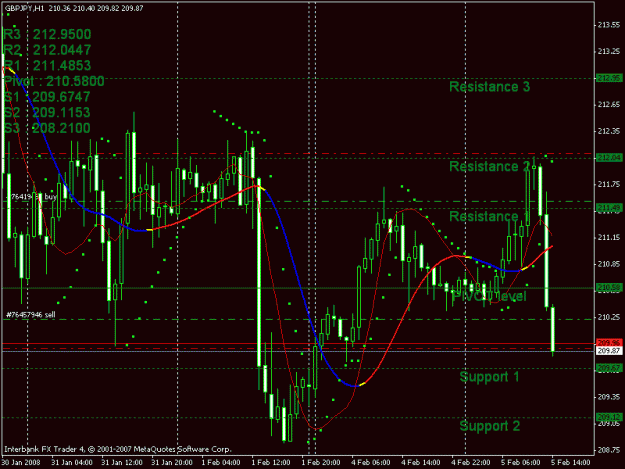
Here is my scalp setup: Bollinger Band + MACD + Optional Pivot Points

I consider Bollinger Bands as a "Frenzy Limit" indicator. Most of the time, when the price goes beyond the band, barring any news/rumor, it is bound to retreat.

I consider the MACD as an "avalanche" indicator. if the height of the MACD peak is flat, I dont expect price to go crashing down. So I trade only when the MACD has peaked (marked by the change in color between red/blue) and about to reverse.

Once I see the price punches through the Bands, *heads up*, and I confirm it with USDJPY and GBPUSD. If all three charts shows no sign of any anomaly, I take a contrarian position shorting a GBPJPY rally, buying a GBPJPY dip for a small 5-10 pips profit.

BTW. Sometimes, the market could still push higher and I would add positions aka Martingale. However, Im not all or nothing here. I definitely close them after clearly seeing it pushing for more.

So far, works most of the time and have made relatively good money in the last 2 weeks of doing it with small 10K~50K lot sizes. There have been 2 days of loosers albeit small amounts, but the winners were far better. I tend to stop trading for the day when I made strings of "errors" signifying bad judgement calls. cool off and trade next day. works wonders.
Attached Image (click to enlarge)
Click to Enlarge

Name: scalp.gif
Size: 15 KB
 
 
  • Post #62
  • Quote
  • Sep 22, 2007 3:54pm Sep 22, 2007 3:54pm
  •  karmostaji
  • Joined Nov 2006 | Status: Dubai | 11,493 Posts
For the past 2 weeks or so, price has been bouncing off the 38.2%, 50%, and 61.8% fib levels on the 4h chart, we also have a triangle, once it breaksout.. we will have a clear direction. 200ema (red line) has been a good resistance.

http://img259.imageshack.us/img259/7936/gjqc4.gif
Trade what you see, not what you think.
 
 
  • Post #63
  • Quote
  • Oct 21, 2007 12:31pm Oct 21, 2007 12:31pm
  •  karmostaji
  • Joined Nov 2006 | Status: Dubai | 11,493 Posts
It seems the majority are having the bear fever for this week and they could be correct, but I don't have that fever yet. On the daily chart, after the reached the 61.8% which we have been waiting for, it was rejected and price has come back down to the 50% (235.20). If we draw a new fibo (green) from the last bull-run from the breakout we had 2 weeks ago, the 50% fibo is right on the daily one and price is current around there, but it could still dip to 61.8% (233.90) area before bouncing back up and most probably going to 243.50 area. Remember, if we get a sell-off or panic selling then everything I just said is useless, so just be careful and don't jump the gun, have patience and wait for confirmation before pulling the trigger, good luck.

http://img235.imageshack.us/img235/7804/gjsi4.gif
Trade what you see, not what you think.
 
 
  • Post #64
  • Quote
  • Oct 21, 2007 1:41pm Oct 21, 2007 1:41pm
  •  JodyOng
  • Joined Jul 2006 | Status: I'm lovin it | 427 Posts
Very true, I myself have not turned and changed my upwards opinion yet but who knows what will happen? Better to wait and see eh?
 
 
  • Post #65
  • Quote
  • Oct 31, 2007 5:05am Oct 31, 2007 5:05am
  •  SeekingLight
  • Joined Jul 2006 | Status: Charts + PA > * | 3,251 Posts
Downtrend line breaks, sideway chan gets re-established, top tested, broken, retested from above, price decides to take off.

Had a nice pin bar at the retested broken TL at the chan low and another when it first failed the chan breakout, formed at the low in the chan middle on top of two former highs(marked in blue).
Attached Image
Trust price. Know yourself.
 
 
  • Post #66
  • Quote
  • Nov 11, 2007 4:00pm Nov 11, 2007 4:00pm
  •  NewstraderFX
  • | Commercial Member | Joined Sep 2006 | 1,007 Posts
It looks like the worm has turned here and that equity markets will go bearish at least until the fed makes it's next rate cut. There's a question of whether that will be enough to shut the bear down though, as the indicies are now below where they were before Sept. 18.

In that scenario, GBP/JPY (and the other JPY crosses too) look to be depreciating over the next several weeks.
 
 
  • Post #67
  • Quote
  • Edited 11:59am Nov 15, 2007 5:21am | Edited 11:59am
  •  SeekingLight
  • Joined Jul 2006 | Status: Charts + PA > * | 3,251 Posts
Quoting SeekingLight
Disliked
A solid scenario for this chart if one is to ignore everything else would be: PB, triggered. Fell to tunnel top, bounced. Now prone to feel gravity again. Could fall back inside, even through it, to retest the big red descending TL it broke out of before, this time lower, at around 191.
Then a bullish setup off of that.

This is all just long term thoughts so the chart might not be of much use to some...thought here'd be a nice place to think crazy thoughts publicly though
Ignored

Been a while, thought I might update this occassionally.
221 needs to go, then we're set for a nice fall.
Still looking for that blue box, then the other blue marked areas.

Monthly charting sure takes it's sweet while, doesn't it

And don't punch the poor chart again Mr. Trend, you'll be scaring it!

Curious to see where we will be in another 3 months.
Attached Image(s) (click to enlarge)
Click to Enlarge

Name: gbpjpy_151107_weekly_1kt_chart_update.gif
Size: 26 KB
Click to Enlarge

Name: gbpjpy_151107_monthly_1kt_chart_update.gif
Size: 26 KB
Trust price. Know yourself.
 
 
  • Post #68
  • Quote
  • Nov 15, 2007 8:40am Nov 15, 2007 8:40am
  •  bunton
  • | Joined Aug 2007 | Status: Member | 1,196 Posts
Also be advised the weekly TF appears to have a S/H/S in the works.. needs to bust the neckline for trigger
Check Mate GAME OVER
 
 
  • Post #69
  • Quote
  • Edited 12:46am Jan 22, 2008 12:43am | Edited 12:46am
  •  FxJarhead
  • | Joined Feb 2007 | Status: Member | 447 Posts
Any one care to kick this around.....seems "trading" has been out of "style" lately.....I had to dig to find this thread.

Anybody see 198.80 area as a possible support area? Lower??

Looking at weeklies for a long term trade.....time will tell, of course.

Fxj
Proper Prior Planning Prevents Piss Poor Performance
 
 
  • Post #70
  • Quote
  • Jan 22, 2008 2:08am Jan 22, 2008 2:08am
  •  billflet
  • Joined Mar 2007 | Status: It's all just noise. | 1,681 Posts
Quoting FxJarhead
Disliked
Any one care to kick this around.....seems "trading" has been out of "style" lately.....I had to dig to find this thread.

Anybody see 198.80 area as a possible support area? Lower??

Looking at weeklies for a long term trade.....time will tell, of course.

Fxj
Ignored
Just curious what you're basing that on, Jon.
198.80 was brief support during Sept. 05. Prior to that it was in a range going back to Jan. 04. 198.80 is pretty close to the median of that range. I like medians.
If I were trying to establish a long term position, I'd be looking at 198.80 also but if that fails, 192.80, and if that fails, 189.50.
Drilling down to the daily charts makes 198.80 a little more attractive.
 
 
  • Post #71
  • Quote
  • Jan 22, 2008 3:02am Jan 22, 2008 3:02am
  •  SeekingLight
  • Joined Jul 2006 | Status: Charts + PA > * | 3,251 Posts
Quoting FxJarhead
Disliked
Any one care to kick this around.....seems "trading" has been out of "style" lately.....I had to dig to find this thread.

Anybody see 198.80 area as a possible support area? Lower??

Looking at weeklies for a long term trade.....time will tell, of course.

Fxj
Ignored
I roughly have 200 and 190 / am aiming for those areas, yes

Let me see if it was also drawn into the posted charts..

Why yes, there we go, just a few posts higher at http://forexfactory.com/showpost.php...8&postcount=67

It clearly marks out both that 200 and 190 area

There you go. It may appear I'm lazy in posting simply because once you post the goal, what more is there to do? You enter, hold, cash in at goal ;p

Looks good so far and feels good to see the theory/plan/scenario from September 2007 come through(yes, I traded it)
Trust price. Know yourself.
 
 
  • Post #72
  • Quote
  • Jan 22, 2008 4:59am Jan 22, 2008 4:59am
  •  forexlion
  • | Additional Username | Joined Sep 2009 | 8,623 Posts
The Lion at work
Attached Image(s) (click to enlarge)
Click to Enlarge

Name: gj.gif
Size: 17 KB
Click to Enlarge

Name: gj2.gif
Size: 17 KB
 
 
  • Post #73
  • Quote
  • Jan 23, 2008 2:58pm Jan 23, 2008 2:58pm
  •  WTB
  • | Commercial Member | Joined Sep 2005 | 1,118 Posts
The breakout of the double bottom at 204.70 will trigger new short opportunities in my opinion.
Attached Image
 
 
  • Post #74
  • Quote
  • Jan 24, 2008 7:08am Jan 24, 2008 7:08am
  •  SeekingLight
  • Joined Jul 2006 | Status: Charts + PA > * | 3,251 Posts
Quoting WTB
Disliked
The breakout of the double bottom at 204.70 will trigger new short opportunities in my opinion.
Ignored
Si, va bene!

This is why I will look for more short entries a bit higher to fall down again from eventually
Might take a while though.
Double bottom breakdown will make a nice place for addons later then..
Trust price. Know yourself.
 
 
  • Post #75
  • Quote
  • Jan 25, 2008 12:41am Jan 25, 2008 12:41am
  •  Plutonite
  • | Joined Mar 2007 | Status: we are stardust, we are golden | 1,364 Posts
Quoting SeekingLight
Disliked
Si, va bene!

This is why I will look for more short entries a bit higher to fall down again from eventually
Might take a while though.
Double bottom breakdown will make a nice place for addons later then..
Ignored
Watch out for a nasty USDJPY. There seems to be a change in trend direction, or at least a large bottom forming, due to all the nonsense with the cuts. Position traders should have their helmets on.

Attached Image (click to enlarge)
Click to Enlarge

Name: shot.gif
Size: 23 KB


Meanwhile, there are a couple of opportunities going long the dollar on some pairs. *Cough* EURUSD *cough*.
Virtue finds and chooses the mean. Aristotle, Ethica Nichomachea
 
 
  • Post #76
  • Quote
  • Edited 5:57am Feb 5, 2008 4:35am | Edited 5:57am
  •  SeekingLight
  • Joined Jul 2006 | Status: Charts + PA > * | 3,251 Posts
Quoting SeekingLight
Disliked
Been a while, thought I might update this occassionally.
221 needs to go, then we're set for a nice fall.
Still looking for that blue box, then the other blue marked areas.

Monthly charting sure takes it's sweet while, doesn't it

And don't punch the poor chart again Mr. Trend, you'll be scaring it!

Curious to see where we will be in another 3 months.
Ignored
Where I said we'd end up. Or rather one of the stations/waypoints.
Hit 205 blue box area(big swing .382 fib -you know, one of those arbitrary magic numbers that have no bearing on price and are all make believe *wink*- with s/r confluence) and made that major bounce from there.

Fundamental terrorists used recent events excuses(cut after cut after cut) for the bounce, I posted about it(potential areas for reaction) last year September and November and based it on TA.
You tell me which can look ahead further / long term better for reactions and triggers.

GJ progression:
http://forexfactory.com/showpost.php...88&postcount=4
http://forexfactory.com/showpost.php...8&postcount=67


If this isn't a point landing then I don't know what is

If being able to mark in reaction spots 4 months ahead of time without needing to read one news item doesn't speak for something then I don't know
Attached Image (click to enlarge)
Click to Enlarge

Name: gbpjpy_080205_monthly_update.gif
Size: 18 KB
Trust price. Know yourself.
 
 
  • Post #77
  • Quote
  • Feb 5, 2008 5:29am Feb 5, 2008 5:29am
  •  fierceman
  • | Joined Mar 2007 | Status: Seņor Member | 801 Posts
Nicely done.
 
 
  • Post #78
  • Quote
  • Feb 5, 2008 6:02am Feb 5, 2008 6:02am
  •  SeekingLight
  • Joined Jul 2006 | Status: Charts + PA > * | 3,251 Posts
Quoting fierceman
Disliked
Nicely done.
Ignored
Thanks...although it IS rather messy...the chart is still a bit clogged with things that had no real bearing on price...in the end, it's always just an evidence gathering process to find likely price resting/reaction points which I try to mark in with blue without ending up with a blue chart..

I just found this chart as well as the EURCHF development I posted in the J16 thread / my journal shows that you can indeed pre-plan likely endpoints / reaction points and think big picture / long term.
And even in the short term there's certain probabilities floating around.
=> EURUSD thread posts on NFP day I think it was(upper TL / s/r reaction line / estimation. Here we are, 200 pips lower from that reaction).

Against the beliefs of many people(this doesn't work, that doesn't work, everything's impossible, arbitrary, random..).
Trust price. Know yourself.
 
 
  • Post #79
  • Quote
  • Feb 5, 2008 9:19am Feb 5, 2008 9:19am
  •  forexlion
  • | Additional Username | Joined Sep 2009 | 8,623 Posts
why is GJ so predictable ?

Goes up to meet R2 then drops to S1.

How and why do these technical indicators work so precisely ? Any comments ?
Attached Image (click to enlarge)
Click to Enlarge

Name: gj.gif
Size: 25 KB
 
 
  • Post #80
  • Quote
  • Feb 5, 2008 10:27am Feb 5, 2008 10:27am
  •  SeekingLight
  • Joined Jul 2006 | Status: Charts + PA > * | 3,251 Posts
Quoting forexlion
Disliked
why is GJ so predictable ?

Goes up to meet R2 then drops to S1.

How and why do these technical indicators work so precisely ? Any comments ?
Ignored
I for one would be wondering how you know ahead of time whether it is R1 or R2 that will cause the/any reaction, and why one will do it over the other, given that it's "so predictable".

I would also like to know why it a) has to go to S1 and b) how you know whether or not it will go several hundred pips more instead, thereby making every pip from the first pip to the xth pip moved any different from the one before in regards to S1 placement.

There, I learned being annoying from the dynamic doubter duo, let's see how well I do ;p
Trust price. Know yourself.
 
 
  • Interactive Trading
  • /
  • Lets Talk GBP/JPY "the geppy"
  • Reply to Thread
    • 1 23Page 456 8
    • 1 3Page 45 8
0 traders viewing now
  • More
Top of Page
  • Facebook
  • Twitter
About FF
  • Mission
  • Products
  • User Guide
  • Media Kit
  • Blog
  • Contact
FF Products
  • Forums
  • Trades
  • Calendar
  • News
  • Market
  • Brokers
  • Trade Explorer
FF Website
  • Homepage
  • Search
  • Members
  • Report a Bug
Follow FF
  • Facebook
  • Twitter

FF Sister Sites:

  • Metals Mine
  • Energy EXCH
  • Crypto Craft

Forex Factory® is a brand of Fair Economy, Inc.

Terms of Service / ©2023