As the screenshot said.. at 04.46 nf time (GMT+2).. for the next trade I'll try to put the chart.. hope this can help me more to understand this great method..
Just a word to Imran...I wanted to thank you for giving me some hope and confidence. I had made an attempt to make some money in the Forex market for going on about 5 years...I didn't...I lost...a lot!!! I gave up!!!
About 2 weeks ago I decided to search thru my old friend the forex factory...we had been apart for a very long time. I stumbled upon your system, i don't know what it was...the simplicity...the solid foundation...i think it was the simple fact that you sounded sincere when you said follow the rules and it will work.
Now I had heard that before, numerous times and I did...and numerous times I would blow out an account. But to me this system seemed different and to me this is why.
With this system I do find that if you wait for just that right time...all of the signals do line up...and when they do it works!!! Everytime!!!
I'm sure your thinking 2 weeks that's not long at all...well for someone who has been out of it as long as I have with a broken will, broken checkbook and broken dream it was enough.
So far I have a streak of 11 winning trades and no losses. Now I know you can't win them all...but I atleast have the confidence back to start putting together a plan and with that kind of ratio......well lets just say I'm back baby!!!
Thanks Imran...hopefully someday I can repay the favor!!
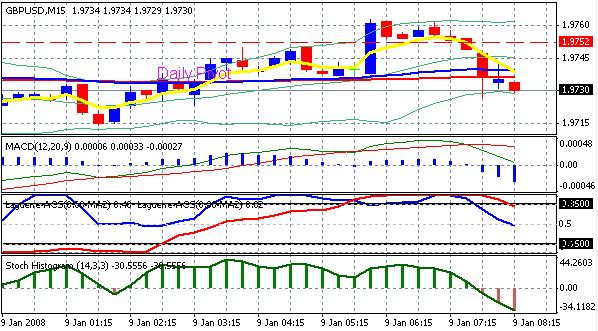
Question: did those two trades marked as green line on chart was taken according to the rules? My reason to take these trades was:
Red lag was above 0,85
MACD turned from negative to positive
candle closed above middle BB
trend was up
Price was above Daily Pivot
Ignored
Hi,
I think the first trade was according to the rules. But the second one is not. The red lag is already on the top extreme, entering now is risky (it can undergo correction or reversal). So, the second entry is a risky one, though it worked here nicely.
We want to see if the red lag has stayed in the opposite extreme for some time or moving in the same direction as our trade. Sometimes, it is mentioned that the red Lag is only for exit, but we have to check this conditions also (it should not be moving against us or reached the same extreme sometime back).
if the Blue Lag crosses 0.15, should the MACD Crossover and Stoch Crossover happen at exactly the same bar as the Laguerre Crossover?
Should you trade when both were already > 0? Or when both cross 0 (for example) one bar after the Lag crosses 0.15, should you get in now or is it too late?
hi
on an ema setting where do you in put the 200 is it in the period slot and what do you put an the shift . how do you in put the two line on the lag ACS1.
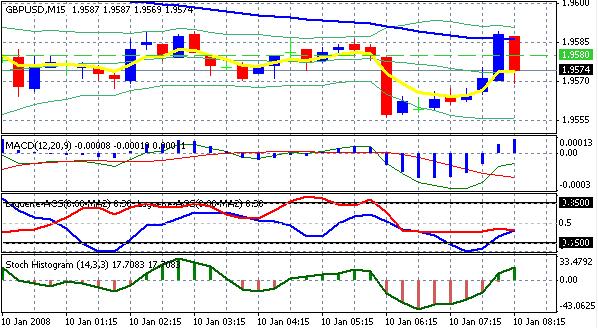
This does same work as Lag with gamma 0.60 setting. I have highlighted the entries for long and short as per the authors on the website, seems decent stuff but need to be careful when price is ranging.
imran
Ignored
~~~~~~~~~~~~~~~~~~~~~~~~~~~~~~~~~~~~~~~~~~~~~
Would like to know what a MOMENTUM - parameter 2 or may be 3 - of the
Inverse Fisher Transform (or LAG 0,60) looks like and what the signals are like.
Should be worth it - even in ranging markets - obviously depending on the
time frame to a certain extent.
Don't have this indicator and your software so I can't do it myself.
I love these video. I could not find video 1. could you point out to me which post? So, I gather from this that we can also look at longer timeframe (1D) and get the potential trade set up.
Also, in Video 3 you show frequency of red and blue lags going up and down close on the x-axis. I thought it was the time period, but mine shows far apart. what are the settings you are using for the lags and time period for the long position trade you showed in this video.
I think first entry was also risky for long, although your reasons are good you forgot the basic entry - blue lag has to crossing 0.15 and in your case the red lag to be crossing 0.45 - I think it was a risk it was at 0.85 - I think it was luck in your favour
if the Blue Lag crosses 0.15, should the MACD Crossover and Stoch Crossover happen at exactly the same bar as the Laguerre Crossover?
Should you trade when both were already > 0? Or when both cross 0 (for example) one bar after the Lag crosses 0.15, should you get in now or is it too late?
Ignored
They need not have to cross exactly on the same bar (that will be rare). If within a few bars (may be two or three) that is fine. If something crossed over quite many bars earlier and the others had not followed, then it is risky to enter, this is my opinion (may be a weak move?).
chandra
hi
on an ema setting where do you in put the 200 is it in the period slot and what do you put an the shift . how do you in put the two line on the lag ACS1.
Ignored
I think you are not ready for trading systems. First you have to understand some basic stuff about basic indicators and your trading platform, before going into advanced indicators and trading systems.
Would like to know what a MOMENTUM - parameter 2 or may be 3 - of the
Inverse Fisher Transform (or LAG 0,60) looks like and what the signals are like.
Should be worth it - even in ranging markets - obviously depending on the
time frame to a certain extent.
Don't have this indicator and your software so I can't do it myself.
Charles
Ignored
We are not at all using Inverse Fisher Transform here! We are using Lag-RSI.
If you don't have the indicator AND the software(?), what is the point of this question. I don't understand.
I love these video. I could not find video 1. could you point out to me which post? So, I gather from this that we can also look at longer timeframe (1D) and get the potential trade set up.
Also, in Video 3 you show frequency of red and blue lags going up and down close on the x-axis. I thought it was the time period, but mine shows far apart. what are the settings you are using for the lags and time period for the long position trade you showed in this video.
Thank
Akalra
Ignored
When you are in YouTube, juct click the author name and youtube will list all the videos by that author.
Yes, longer TF also works. Many people like the 15M chart, especially when the market is making smooth moves. That needs patience to wait for the proper setup. Some are using in 1H chart. I am not sure if anyone is using in daily chart. I also don't know whether they all use the same settings for higher TF or not.
From what I can see, the video-3 has hourly chart (just by comparing it with my 1H chart). But I cannot see the Lag settings.
Thanks for your sharing. I'm newbie in forex market.
Btw, I already read your material in PDF. found question :
1. for long trade we have to look price is below or above daily chart ? since i see the graph its below daily pivot but in your wording should be above daily pivot ?
2. I also see Laguerre. In your sample chart the laguaerre have the same directly .. if blue up red up also. But I try the laguerre in some other chart sometimes mention blue up and red down.. Wht that mean ?
Hope my english not confuse you .. since me from South East Asia country.