This post has a good description of pivot points and their corresponding s/r plots. http://www.forexfactory.com/showthread.php?t=5441
You could try this post for some pivot indicators.
http://www.forexfactory.com/showpost...23&postcount=2
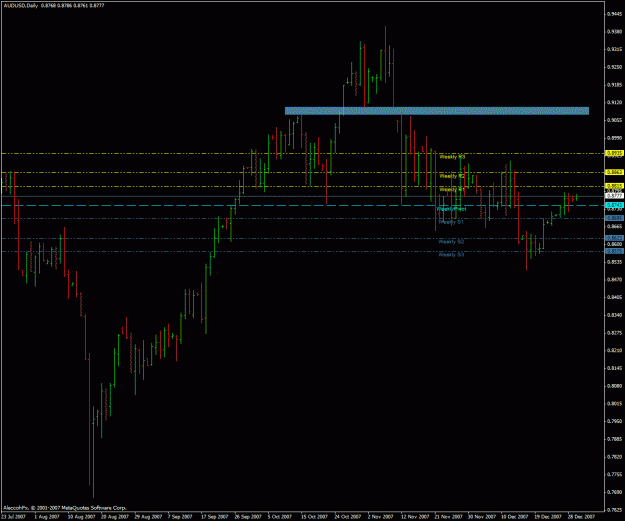
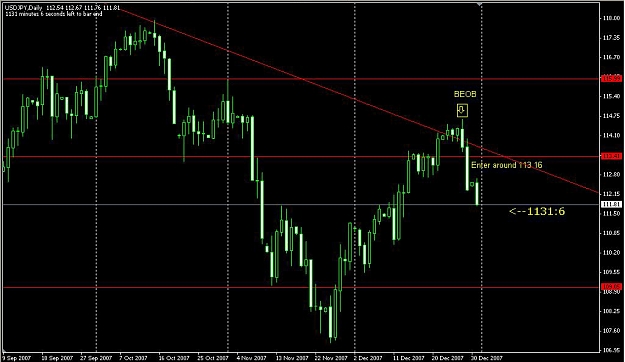
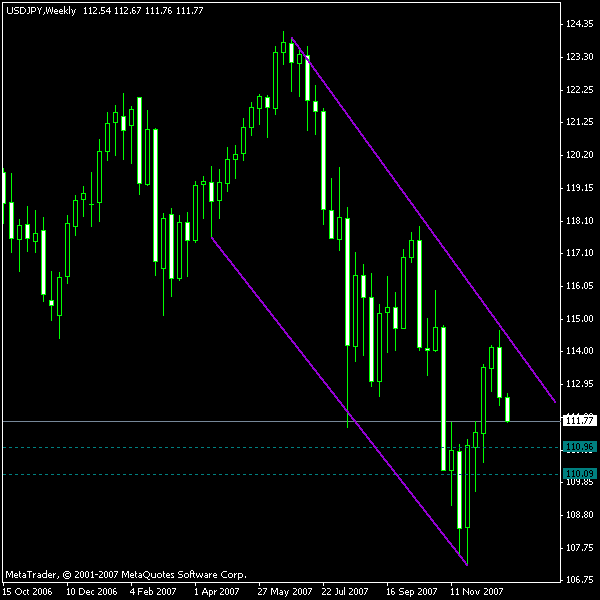
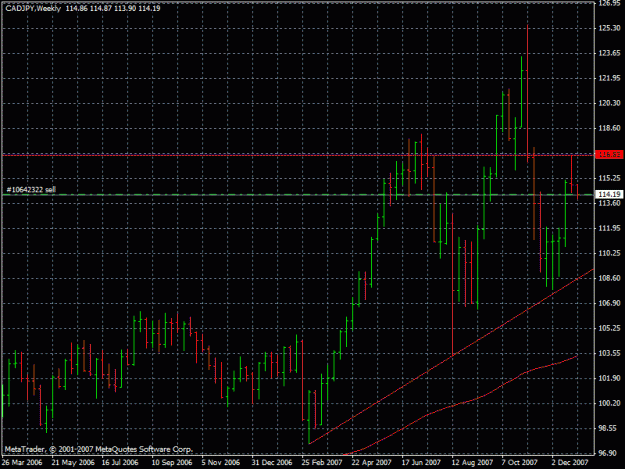
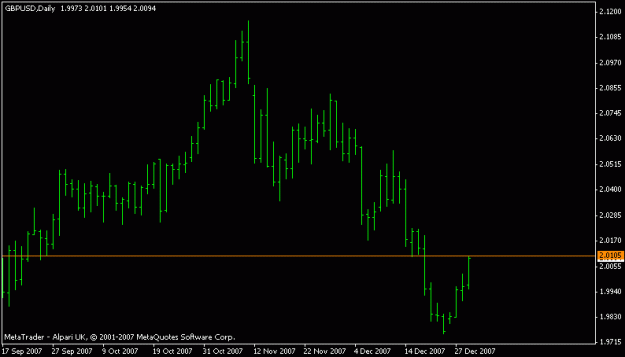
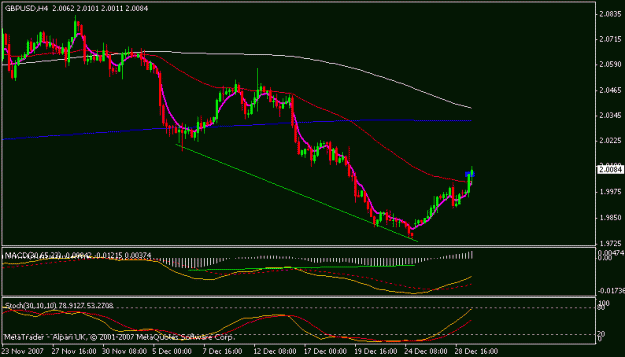
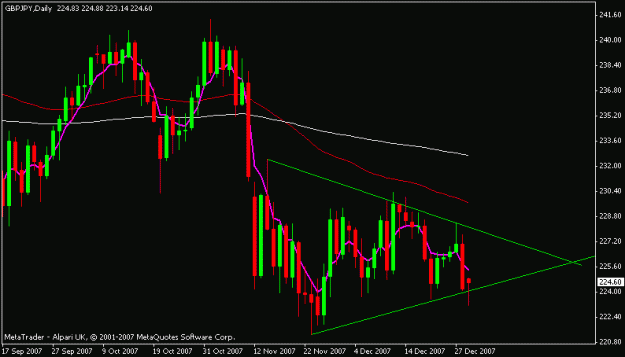
Where can I learn more about Price Action like those in James16 charts? 9 replies
DislikedHello giuhd,
[font=Verdana][color=black]Different brokers have different price action as it is their individual customers which move their charts, [font=Verdana]Ignored
DislikedAre you sure about this... ??? Different brokers show different candles because they aren't geared to the same time frame...
I don't think the individual customers of a broker change that brokers charts...!!!Ignored
DislikedMike,
This is the one I was talking about.
Entered on green line with SL at Red line.
Thanks,
TradeStarIgnored
Dislikedbreak down below PPZ... retrace to resistance / ppz... SHORT... break down again... retrace to resistance / ppz...
This just has never really clicked with me.... until today...!!! A revalation...!!!!!!
...Ignored
DislikedHey Tiki,
Sometimes when you wait for retracement it never happens and if it does, it might be a full blown reversal like with u/c few weeks ago. Anyways, a friend of mine collected several hundred pips on this move alone and is looking for about 80-100ps more.
Very well done..., this would be my wish for the New Year: a transition from 80-160ps scalps to catching the big ones....
Happy New 2008 everyone!Ignored
DislikedHello Tiki,
My oversight, you are absolutely right. We are currently on the 0300 bar on the Interbank chart and 0500 on the North Finance chart, so this definitely will affect how the bars present. I was mainly trying to point out that the charts will be different with different brokers. I do think the the cumulative
total of a brokers trades have to affect its posted price but it wil only differ a few pips on the hourly bars . Take the 1100 hourly bar on 122807 on Interbank's chart and it shows the close as 1.9996, while the 1300 hourly bar on 122807 on North Finance's chart shows the close as 1.9987. It clearly seems they coordinate fairly closely but without a common clearing house there is bound to be some variance in price. This variance if you take out the variables and adapt the charts (such as 1100/1300 hourly bars & the weekly close price) must be affected by the trades the individual brokers post.
I am sure individual traders don't affect the price but the cumulative total of a brokers customers has to affect the price. Oh and I'm not completely sure about the mechanics, I'm just sayin.
I see you are from Houston, a suburb of my city, Pasadena.
Keep taking those pips,
RoyIgnored
DislikedHey mrozibakar,
Check this link out http://www.forexfactory.com/showthre...=2331&page=370
Post #5541
Those two files are just about pin bar.
Hope this will help.
QiuIgnored
DislikedHey Tiki,
Sometimes when you wait for retracement it never happens and if it does, it might be a full blown reversal like with u/c few weeks ago. Anyways, a friend of mine collected several hundred pips on this move alone and is looking for about 80-100ps more.
Very well done..., this would be my wish for the New Year: a transition from 80-160ps scalps to catching the big ones....
Happy New 2008 everyone!Ignored
DislikedHello giuhd,
Different brokers have different price action as it is their individual customers which move their charts, as opposed to commodities or the stock markets, which have a central clearing house which consolidate all the different brokers prices to one price at one place in time. I use Interbank FX and North Finance and the price bars will frequently be different for any bar.
As examples
This is Interbank for 122807, clearly a pinbar:
http://www.forexfactory.com/attachme...1&d=1199067242
This is North Finance for 122807, the open and close are not within 1/3 of the high or low so no pinbar:
http://www.forexfactory.com/attachme...1&d=1199067396
The advise I have received is that you trade from what your chart says it is.
This is a more ideal pinbar, the size is right and the position is right ( it’s at the end of a big run up), with a good long tail.
http://www.forexfactory.com/attachme...1&d=1199067738
In regards to your post #8450, it may turn out well, but I wouldn't take it because based on just the pinbar it is not a A+ (if it were on 50% or 61.8% fib line, or at a PPZ, or at a major moving average, or even better at a confluence of these it would be more of an A+ trade). I try to only take trades which put the odds more in my favor.
Sorry for the delay in getting back to you,
Roy
Ignored
DislikedPPZ areas are determined at areas where price has clearly and repeatedly found S/R. They are not pivot points, although you may find them in similiar areas. I would not count this as a PPZ in your chart. Also, I would encourage you to go through this thread and read past posts. Many of your questions will be answered, and pay attention to James16's posts. Good pips.Ignored