Sigh, I knew it was all or nothing,but again testing is easier because there are no ambiguities. I will point out that... I am getting fibs that are within 2-5 pips a lot... does that make them wrong? I will take that brand of wrong and set a fuzzy tp
gwah... I will try to reverse engineer it as well. because I can;t make heads or tails of it. wait just did... I can get those results from fibbing a 1 hour not a 4 hour and using the method we pm'd about. try it! The swing low doesn;t change and when I was in a live trade with gbp/jpy (after the fact) I was using the 1hr chart to draw fibs.
Off topic, that indian gentleman, Forexlion, mentioned different pairs having certain fib tf cycles they followed... I wonder ? any thoughts? My E/A chart was drawn on a higher tf then shown. Did skunny mention anything abou this or did he say it was a universal method?
Lowell.
Do you have a data set on those weeklies? MEA CULPA I never fibbed the weeklies, but I will this weekend UNLESS it is a moot point as skunny said you might have to go to a lower tf thereby invalidating the overall predictivity of the weekly bar candle.
Sizz
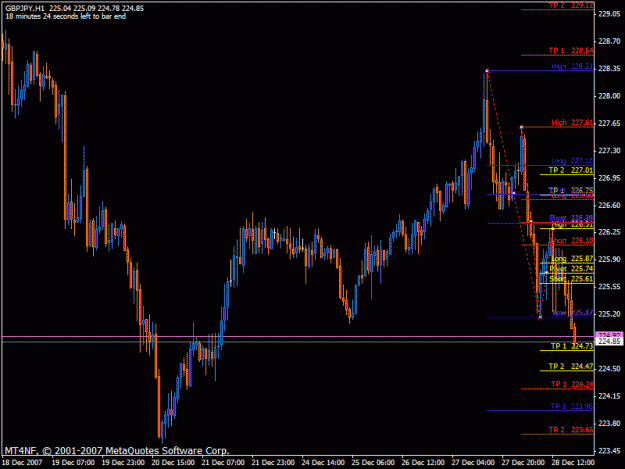
DislikedSadly, it was drawn retroactively. But Skunny told me in a pm that if price doesn't react perfectly to the fib, it is drawn incorrectly. So I'm just playing around drawing fibs in different ways after a move, hoping for a clue.
Have any of you really studied the trades that Skunny posted earlier on this thread? I can't help but think there is surely a clue in the fibs he drew.
I think our biggest question here is how to look at a chart and know exactly the beginning and end of a cycle. I have a hunch there is a way to tell by observing PA alone. IF.........BIG IF we know exactly what to look for.
Something that I keep remembering is what Skunny told Blueruby early in the thread about fibbing only the weekly bars. 11 out of the 52 bars Blueruby fibbed would have hit the SL before TP if the TP was set at the 138 after penetration and the SL at the 0 line.
SKUNNY'S HINT: "Don't worry about the winners, just figure out what was different about the losers."
The losing bars had the open and close inside the following bars open/close.
I fibbed the losers and one thing I noticed was that on the losers, after price penetrated the 0 or 100 lines, it retraced back past the 50 line. It seems the winners never retraced past the 50 line before hitting the 138.
So maybe IF the fib is drawn correctly, we can set our SL on the opposite side of the 50 line and be prepared as Skunny says to trade in the opposite direction if the SL is hit? Please test this for yourselves. I have'nt done it enough to form a definite conclusion.
On a side note: Assuming that truly this method is perfect if applied properly, then the losing weekly bars were in the middle of a cycle and the winners were completed cycles. Dunno if I'm making any sense.:
Ignored