|
Joined Jun 2006
|
Status: Patience, Discipline & Desire!!!
|291 Posts
Hi folks,
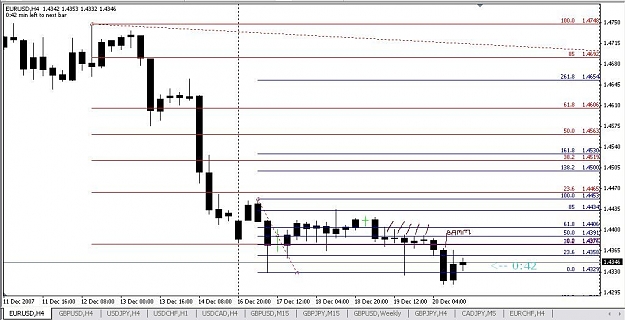
Ok here is a trade I entered today. It's not picture perfect as far as the example I was speaking of earlier but it is still a good trade nonetheless.
It shows an example of how and why I take a trade opposite the major trend.
On the weekly chart we can see that last wek closd on weakness and at an area of previous resistance. So this to me is a heads up that a trade opportunity could happen.
So I watch the 4H chart. WOW look at all the weakness from the previous weeks highs. Ok clearly something may happen here. Then look at the are in the blue box. This is where I entered. I know I have not got into a lot of detail yet about entries outside of the 1-2-3 formations but this is how I do it. If you look cloesly in the blue box you will see whee there is a 3 bars that form a failed high. This is what I am looking for. but it's not just that this formation appreared it's the fact that this formation occured after breaking back down through previous support and the formation of last wek on th weekly chart.
Right now this trade is up 88 pips my TP zone is the blue line at the bottom of the chart but I will watch closely at the blue line marked Trouble area.
Also I am locked in for profi at the yellow line.
See if you can figure out why I marked it a trouble area.
|
Joined Jun 2006
|
Status: Patience, Discipline & Desire!!!
|291 Posts
This is a great site FP. I came across this site about 2 years ago. There is a lot of grea information on here. Much of it is geared to the futures and stock markets but it still applies.
|
Joined May 2007
|
Status: Learn to be fearless
|68 Posts
Hi Trader_V,
Thank you for your detailed explanation and examples of trading with chart formations and S/R levels. I tended to use it from time to time but now I try to focus on them without using indicators. It may take some time for me to train to be skillful at it and have a better feelings of what's happening and what's going to happen after an entry.
For the 1-2-3 formation or alike, I understand you trade at H4 and higher. But it's my own personal limitation that I tend to go to the smaller timeframe for better entry level after finding a trend in H4 or daily chart. In the smaller timeframe it appears to me it is more safe to enter a trade at 3, ie. S1, S2... (after seeing some support there) rather than breaking out of 2 =, ie. E1, E2... For entry after breakout of 2, it could be a false breakout of 2 if I don't wait for some support after 2. If I enter after some support after breakout of 2, it's already pretty close to next reisistance level, due to the smaller timeframe problem.
Back to entry at 3, when the price is going to 2, I can be already in some profit seeing if it can breakout at 2, and then become a bigger run. If it can't breakout at 2, and retrace back to 3, I can be stopped out with a little profit or breakeven, just like trading in channels.
Ok here is a trade I entered today. It's not picture perfect as far as the example I was speaking of earlier but it is still a good trade nonetheless.
It shows an example of how and why I take a trade opposite the major trend.
On the weekly chart we can see that last wek closd on weakness and at an area of previous resistance. So this to me is a heads up that a trade opportunity could happen.
So I watch the 4H chart. WOW look at all the weakness from the previous weeks highs. Ok clearly something may happen here. Then look at the are in the blue box. This is where I entered. I know I have not got into a lot of detail yet about entries outside of the 1-2-3 formations but this is how I do it. If you look cloesly in the blue box you will see whee there is a 3 bars that form a failed high. This is what I am looking for. but it's not just that this formation appreared it's the fact that this formation occured after breaking back down through previous support and the formation of last wek on th weekly chart.
Right now this trade is up 88 pips my TP zone is the blue line at the bottom of the chart but I will watch closely at the blue line marked Trouble area.
Also I am locked in for profi at the yellow line.
See if you can figure out why I marked it a trouble area.
|
Joined Jun 2006
|
Status: Patience, Discipline & Desire!!!
|291 Posts
Tanks Oromis.
Ok here is how I see things.
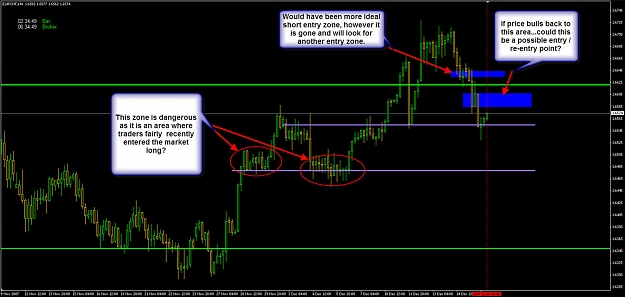
The line is clearly a S/R zone. Last time here it bounced hard at the purple box. We find ourselves here again and ned to watch carefully. If prices break through the blue line we will likely drop to the 1.6460 1.6480 area. so if a new swing high is formed befoe reaching the area where the Caution to the up side sign is then I would look for a short. But there may be another swing low created next which could see us go even higher and a return to the dominant trend.
This is where being patient pays off. Watch it see what forms and when it becomes a clear trigger formation PULL THE TRIGGER
Hi everyone! I hope you all are having a great holiday season! I know I am
I noticed come questions about trend direction and referencing longer time frames. So I put together this little document to hopefully show how I do some things. It's by no means extremly comprehensive but I hope it will be helpful for some of you.
If you have questions or comments I encourage you to ask. With your help I may be able to clear up some areas of this doc that may be vauge or not well explained so that others can get some use of this.
I've been spending some time over in "Skunny"'s thread.
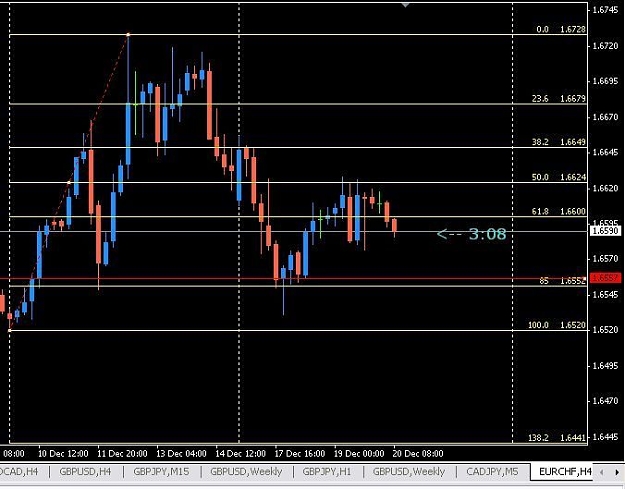
Looking at your EUR/CHF chart I see a couple of things.
after placing a fib on the previous weekly candle I then went down to the 4hr chart and see that the S/R line you have drawn is just above the 38% fib too.
after the candles clean break of the 38% fib there was some interesting things going on there.
1) a "V" formation on the 4hr candles
2) after the clean break of the 38% fib, there were then 5 consecutive 4hr candle attempts at breaking back through the 38% fib but none were successful, some penetrated but none actually closed above the 38% fib.
3) looking at it in hind sight I can see that the 38% fib was a perfect entry point, and your TP level was dead on.
|
Joined Jun 2006
|
Status: Patience, Discipline & Desire!!!
|291 Posts
Hi Piphitman,
Thanks for the Kudos and observations. The funny thing is of all this, I don't draw Fib retracements I just call it like I see it on the charts. Areas of S/R are easy to find and recognize with a little practice. These areas are of real importance as you have seen and they sometimes coinside with other things such as trendlines, fibs, and other technical tools.
I would like to the Eur/Usd chart here. It explains this perfectly. Dropping a Fib on this last swing we can see price has retraced to the 61.8 level. And it just so happens tat this level is also a zone of previous resistance to the upside which could prove to be very important and and become a great support level. I will be watching price action in this area to see if the bullish trend shall continue.
But these are kust the observations of a lonely trader
I've been spending some time over in "Skunny"'s thread.
Looking at your EUR/CHF chart I see a couple of things.
after placing a fib on the previous weekly candle I then went down to the 4hr chart and see that the S/R line you have drawn is just above the 38% fib too.
after the candles clean break of the 38% fib there was some interesting things going on there.
1) a "V" formation on the 4hr candles
2) after the clean break of the 38% fib, there were then 5 consecutive 4hr candle attempts at breaking back through the 38% fib but none were successful, some penetrated but none actually closed above the 38% fib.
3) looking at it in hind sight I can see that the 38% fib was a perfect entry point, and your TP level was dead on.
|
Joined Jun 2006
|
Status: Patience, Discipline & Desire!!!
|291 Posts
Ok I know I posted an update previously but I just wanted to show how price has reacted to the areas that I have pointed out on a previous chart I posted here.
If we can get out of our own way price will show us what it want to do.
|
Joined Jun 2006
|
Status: Patience, Discipline & Desire!!!
|291 Posts
You got it my friend! James calls it confluence. The coming together of multiple signs that price may react in a specified area. Wit for it to happen and this will add value to your trades.
Trust me I am a sniper in real life and patience is a huge piece of the puzzle.
Excellent observations and congrats on the progress.
All the best and Merry Christmas to all here.
TV
Ignored
Merry Chrismas to you, Feb and all the other friends here.
Your E/U chart is great, I will follow this pair to see if it will end dropping and increase again.
P.S. Where is Feb?
P.S. No. 2: Eur and Chf are highly correlated (about 90%). Some friends told me that EUR/CHF sucks: the range of change is very narrow.