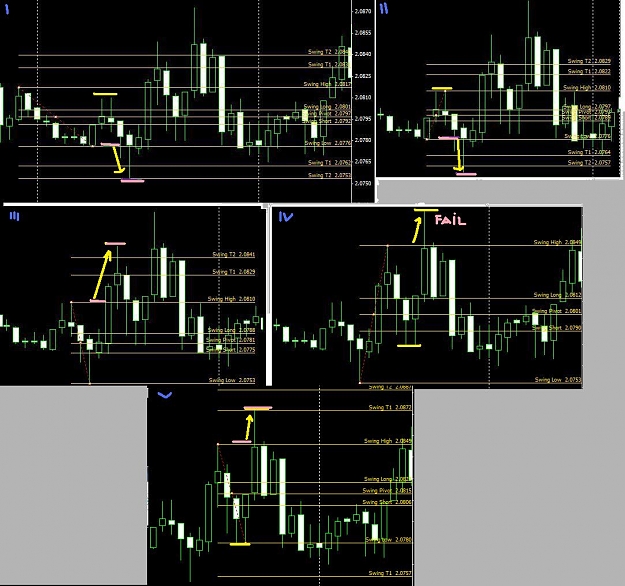
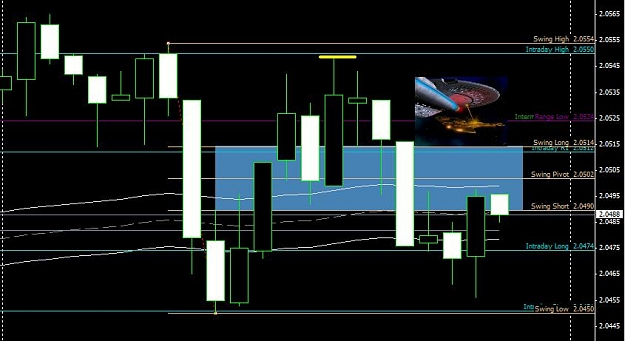
Here's a picture that almost explains what I am talking about from today's chart. It's not the best example because the swings within the outer swing are almost reaching the extremes and it's not very much different to change target levels.
The neutral zone is the blue box. The swing fib is the "next swing" that can be pulled after the small 11 pip short just after the Asian session when my keyboard batteries died this morning.
Candles start moving up, establishing the swing low, and they seem to want to keep going, but they don't break the swing high. They do form 1 bearish candle retreat that could cause confusion in 2 ways.
First, would someone consider this as having formed a new high, and pull swing high here? If so, the trade bias is long by looking at the real body of the candle, then things start to take off long and they break that recent high, only to fail (on the yellow line drawn).
Second potential problem, do we pull the swing low to the bottom of the bearish candle before the failed long breakout candle, since the swing range is big enough to consider? We could probably take a successful short after the failed long by doing that, but maybe it only works out in this case for the better, if we keep pulling swings so suddenly like this, we could get whipsawed in a way that could be avoided if we just leave the outer swing in place for now and not take any trades including the failed potential long because swing high is still above there as drawn.
My proposal is leaving swing high as is, and if a break occurs, take it as usual, but if candles cross below the neutral zone back where they started near swing low and try to break low, I wouldn't keep the same T1 and T2 levels. After the short break (which didn't occur today) I would calculate T1 and T2 by moving swing high down to the inner high marked by the yellow line. This is a bad example but on Nov 1 there was a break of the swing high after a failed neutral zone cross down, a retreat to the long bias, and a break that didn't go as far as the full swing would have liked. But if the swing low were pulled up to the failed cross low, T1 was ok.
I don't know if this is a case of curve fitting on one observation made, or if it makes any rational sense for pulling swings. We'll see.
I also don't know if it is as simple as narrowing in the opposite extreme end of the swing whenever some significant cross occurs. In today's chart for example, when candles started out at the swing low and moved up to the long side and formed that first possible peak to bring a new swing high (before the yellow break out happened), we leave everything alone and no highs get broken, then eventually that big bear fully crosses the neutral zone and brings the bias short again...by the time that candle had made it down through swing short, we could have safely finally pulled swing high down to the yellow line and left it there, then if a short happens we have the better-targets in place...and if something crosses up past swing long again, we bring in the swing low...
It can't be so simple as just pulling new swings when 61.8% is retraced, that happens often in spikes. Maybe just when the official bias changes with real bodies crossing 61.8% would work out...
Another easy answer - don't trade because candles are being pulled into the worm hole..I mean 64 envelope. But that's too simple.
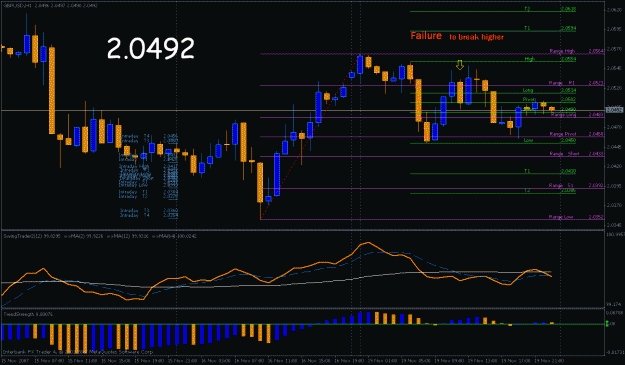
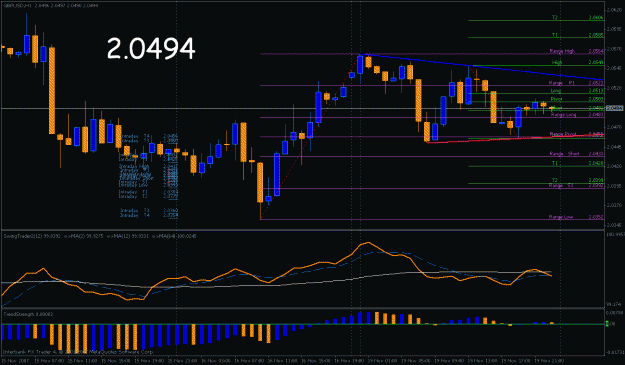
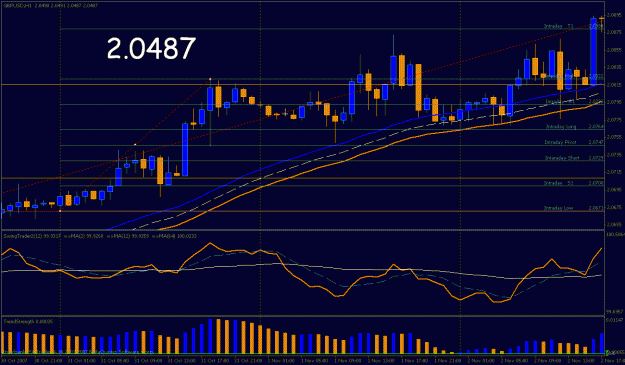
Attached Image (click to enlarge)
"Support and Resistance either holds or it doesn't."
-Anonymous hillbilly