DislikedHi Moneda,
You have a good eye.
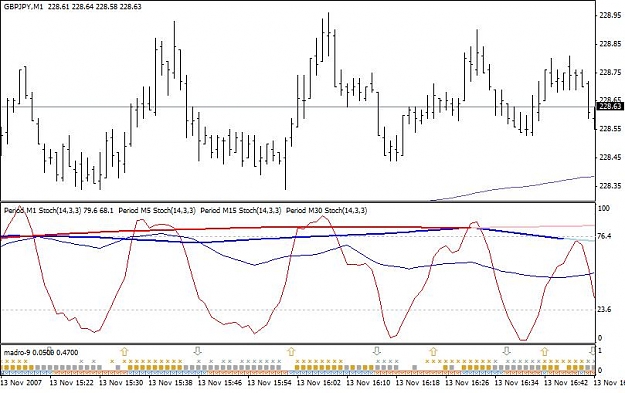
Sorry for the error -- it was the 5M that was oversold, not the 15M. The chart itself, however, is not incorrect, just the line definitions. Corrected, they should be 5-30-60-4H not 15-30-60-4H.
I had no trouble replicating the chart for (below) with just the 5M and 4H shown for clarity. Although best viewed on a 15M chart, when viewed in a 5M TF the MTF stoch lines move differently but still demonstrate the same endpoints. That is, except for the 5M which is accurate here since this is a 5M chart and the way I'm set up, my shortest TF line is always the current TF.
In other words, when I change the chart TF to 15M, the first (shortest stoch) line becomes the 15M stoch. When I change the TF to 60M, the first line becomes the 60M stoch, and so on.
My broker is GMT.
I have no explanation for why your chart differs from mine. The 5M clearly went into overbought; If I'm not mistaken, I was chatting with another trader at the time of the trade, and pretty sure he saw what I saw.
No smoke, no mirrors http://www.forexfactory.com/images/icons/icon10.gif
Hope that helps...
EDIT: Unfortunately, old habits die hard. I've mislabeled the 5m line on the chart below as 15M! It is, in fact, the 5M. It's past my bedtime!!Ignored
Jeff,
Thanks for the explanation. I have no explanation for the difference in our charts either. Perhaps the difference has to do with our broker's platform (gmt vs. gmt+2). I have read elsewhere in this forum that the candle formation can differ between brokers depending on their geographical location. Maybe it also affects the stochs. Anyway, the important thing is that you made some pips. Is there anyone outthere that can explain the difference?
Unus pro omnibus, omnes pro uno