there seems to be a refresh problem with this indicator. I need to switch back and forth between TF's, otherwise I don't get new points displayed. Did I find an early development version, or is your version behaving similarly?
Could someone explain to me how the 'Auto Daily Pivot' indicator works? Does it re-adjust itself for every new day at 0:00GMT? The you can see whether days open is above or below it? and what do the S and R values represent?
Thank you
24 hours in a day – 24 bottles of beer in a case – Coincidence? I think not
This is going worse and worse, since a few days there was somtime several hours of lag in between messages in the skype chat room.
Since yesterday I've been able to see and or post messages may be only a few minutes per day, then during hours the chat stay frozen just showing the last chats, then suddenly there is a bunch of old messages comming, sometime not even in sequence and a few minutes later it freeze again for several hours.
I'm wondering if it's my computer (but I still can communicate with my other skype contacts without any problems) or something concerning this particuliar chat room. What I don't understand is that during the frozen time on my comp some people are still able to communicate as I can see their messages several hours later! (So it looks it's not frozen at the same time everywhere)
I'm a little bit dispointed because this is a valuable tool I am (and may be others) not able to use.
Does anybody have the same problem and or know how to fix it. Loging out and in again doesn't solve anything!
I also have send a PM to Imran to make him aware of that if he is not already.
Thanks for your answer and have a good week end.
PS. 3rd week positive with this system.
there seems to be a refresh problem with this indicator. I need to switch back and forth between TF's, otherwise I don't get new points displayed. Did I find an early development version, or is your version behaving similarly?
Ohka
Ignored
yeah... i have same version with the "refresh problem"
Do you always trade in only the direction of the daily pivot indicator? (ie. when the price is above the daily pivot only trade long, when below only trade short).
If you'd followed the system strictly today you'd have shorted just below the pivot and been taking profit right about now for about 500 pips. Very nice.
One thing I would add is that the 30 minute rule works fine for most economic releases but for the really big releases, especially the interest rate decisions, it's better to follow a 2 hour rule before the release. Maybe even don't trade at all on the day until at least half an hour after the decision. That would have kept me out of a bad trade on Thursday.
Do you always trade in only the direction of the daily pivot indicator? (ie. when the price is above the daily pivot only trade long, when below only trade short).
Thanks in advance.
Ignored
I think that is a good indication of the move but what do the S and R values tell me? Does the Auto Daily pivot indicator adjust itself daily at 00:00 GMT?
24 hours in a day – 24 bottles of beer in a case – Coincidence? I think not
If you'd followed the system strictly today you'd have shorted just below the pivot and been taking profit right about now for about 500 pips. Very nice.
One thing I would add is that the 30 minute rule works fine for most economic releases but for the really big releases, especially the interest rate decisions, it's better to follow a 2 hour rule before the release. Maybe even don't trade at all on the day until at least half an hour after the decision. That would have kept me out of a bad trade on Thursday.
Ignored
Thanks notouch! unfortunately I missed out on the big trade today. I am in the eastern time zone which is tough for wannabe traders.
I placed my first trade using this system today on a mini - went long at about 17:20 gmt and got stopped out.
After going back and reading the instructions again, I noticed it mentioned trading above the daily pivot for longs but not for shorts, so when setting up my trade I didn't see the daily pivot comment...Oh well, "my bad" I'll chalk that loss up to another fx learning experience!
I think that is a good indication of the move but what do the S and R values tell me? Does the Auto Daily pivot indicator adjust itself daily at 00:00 GMT?
Ignored
Good question matrixebiz, I'll check the indicator code and see if I can find an answer.
I think that is a good indication of the move but what do the S and R values tell me? Does the Auto Daily pivot indicator adjust itself daily at 00:00 GMT?
Ignored
Looks like the pivot re-sets daily at 00:00 GMT, here's the code, if that is the time on your broker uses on the metatrader software:
if (Use_Sunday_Data == false)
{
while (DayOfWeek() == 1)
{
Ok, great, thank you. What do the S and R lines tell me?
Ignored
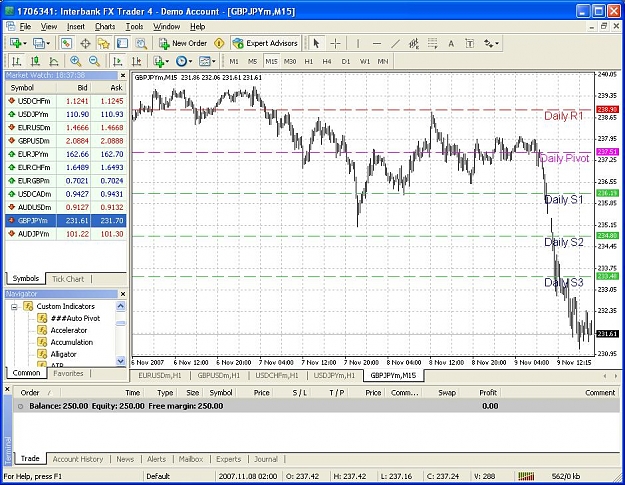
Those are support and resistance lines. If you look right now at the gbp/jpy 15 min chart, you'll notice that the price has been bouncing off the support of 231.77. A break down below that level means that the price should fall further - Theoretically to the next S and R line (which is not plotted).
But if you look at the daily chart you can plot the next support level at around 230.16
Hope this helps.
Ignored
Does my chart look correct with the pivots? how many S lines are there supposed to be?
Attached Image (click to enlarge)
24 hours in a day – 24 bottles of beer in a case – Coincidence? I think not
No, I was just looking at the pivot lines. What version of ### Auto Pivot do you have loaded? I'm using the one from the first post. I don't know why my S3 is up higher than yours
24 hours in a day – 24 bottles of beer in a case – Coincidence? I think not
No, I was just looking at the pivot lines. What version of ### Auto Pivot do you have loaded? I'm using the one from the first post. I don't know why my S3 is up higher than yours
Imran, Thank you and hamdAlla for the best system in Forex Factory!
For someone starting with a small account, with 1/100 leverage, there's no way to try to capture trends with the balance swinging up and down. This must be what bank traders use! If I can manage to live indoors long enough to do it this will be the thing that finally made a difference.