[quote=pips4uandme;1678572]Hi JimDandy!
I quoted your post b/c I want to reference your chart that you use for it (the 1 hour divergence setup)...Are you looking at bullish divergence with your line? If so, there is a serious problem with it that you need to correct. The starting point on the MACD absolutely has to line up with the candle you start your support/resistance line from. By eyeballing your chart, it doesn't appear to be divergent on this time frame and area.
Happy Pipping to you!
Pips[/quote
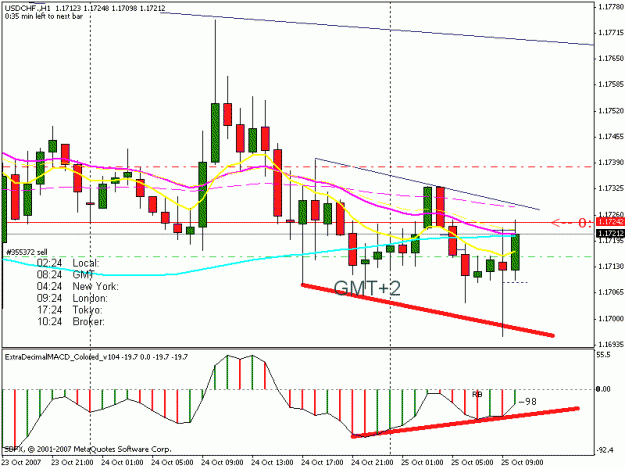
Same chart I posted earlier but lines drawn in less of a hurry. Still looks like divergence to me. But maybe not? Maybe i dont know what to look for and need to adjust my eyeballs............
I quoted your post b/c I want to reference your chart that you use for it (the 1 hour divergence setup)...Are you looking at bullish divergence with your line? If so, there is a serious problem with it that you need to correct. The starting point on the MACD absolutely has to line up with the candle you start your support/resistance line from. By eyeballing your chart, it doesn't appear to be divergent on this time frame and area.
Happy Pipping to you!
Pips[/quote
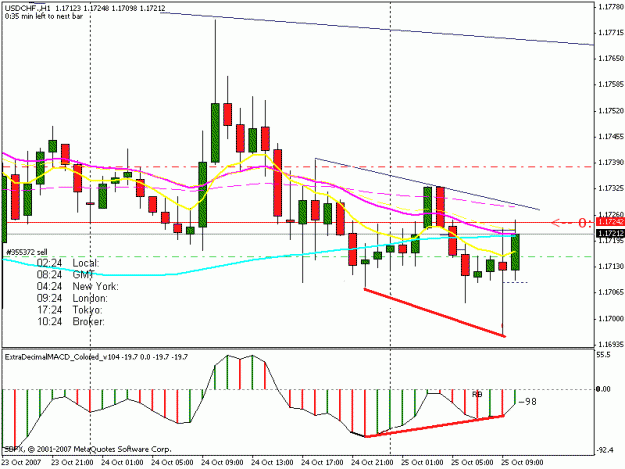
Same chart I posted earlier but lines drawn in less of a hurry. Still looks like divergence to me. But maybe not? Maybe i dont know what to look for and need to adjust my eyeballs............
Attached Image(s) (click to enlarge)