• Home
  • Forums
  • Trades
  • News
  • Calendar
  • Market
  • Brokers
  • Login
  • Join
  • User/Email: Password:
  • 9:04pm
Menu
  • Forums
  • Trades
  • News
  • Calendar
  • Market
  • Brokers
  • Login
  • Join
  • 9:04pm
Sister Sites
  • Metals Mine
  • Energy EXCH
  • Crypto Craft

Options

Bookmark Thread

First Page First Unread Last Page Last Post

Print Thread

Similar Threads

NITRO Scalping for serious traders 863 replies

Serious chart problems that could destroy your strategy 17 replies

The 3rd Dimension chart reading~TADfx 9 replies

Reading......and reading....... 21 replies

  • Trading Discussion
  • /
  • Reply to Thread
  • Subscribe
  • 56
Attachments: CHART Reading for serious traders
Exit Attachments

CHART Reading for serious traders

  • Last Post
  •  
  • 1 1011Page 121314 23
  • 1 11Page 1213 23
  •  
  • Post #221
  • Quote
  • Oct 26, 2007 7:22pm Oct 26, 2007 7:22pm
  •  ActioReactio
  • | Joined Oct 2007 | Status: Member | 38 Posts
Gene22,

I have put it into an excel spreadsheet, but do it manually. As for starting point, as much daily data as I can get my hands on and an ephemeris.
 
 
  • Post #222
  • Quote
  • Oct 26, 2007 7:47pm Oct 26, 2007 7:47pm
  •  MoForce
  • | Joined Jul 2007 | Status: BIG PIPIN' | 615 Posts
Here's an update of the chart setup I've been using....as you can see that 50% retracement level shown has proven to be a strong resistance level for upward movement
Attached Image
 
 
  • Post #223
  • Quote
  • Oct 27, 2007 7:06am Oct 27, 2007 7:06am
  •  PipChick
  • | Membership Revoked | Joined Sep 2007 | 4,407 Posts
Quoting ActioReactio
Disliked
Oh really? Maybe I miss understand "predicting" a market. Each year, I predict where the markets I trade will be over the course of a year. In my way of thinking, prediction does not have to be 100%, 90% is just fine with me. Time-price trading is based on just this: predicting at what time a currency will be at what price whether by using cycles, fibonacci, angle projections, or chicken bones.

Attached is my yearly gbp/jpy prediction. It was completed in December of last year. So far, it has captured the movement of this currency. Most can not make such a prediction, but there are those that can with reasonable accuracy.
Ignored
Very nice Actio!!
I was meaning that one cannot predict on a daily basis or hour by hour basis but your chart is very interresting. Maybe you could teach us how to predict the longer term as you have done. It could be helpful in trading to know where price may go.
 
 
  • Post #224
  • Quote
  • Oct 27, 2007 7:08am Oct 27, 2007 7:08am
  •  PipChick
  • | Membership Revoked | Joined Sep 2007 | 4,407 Posts
Quoting MoForce
Disliked
Here's an update of the chart setup I've been using....as you can see that 50% retracement level shown has proven to be a strong resistance level for upward movement
Ignored
Seems like we made a new higher lo. Price just keeps inching its way up.
 
 
  • Post #225
  • Quote
  • Oct 27, 2007 7:21am Oct 27, 2007 7:21am
  •  PipChick
  • | Membership Revoked | Joined Sep 2007 | 4,407 Posts
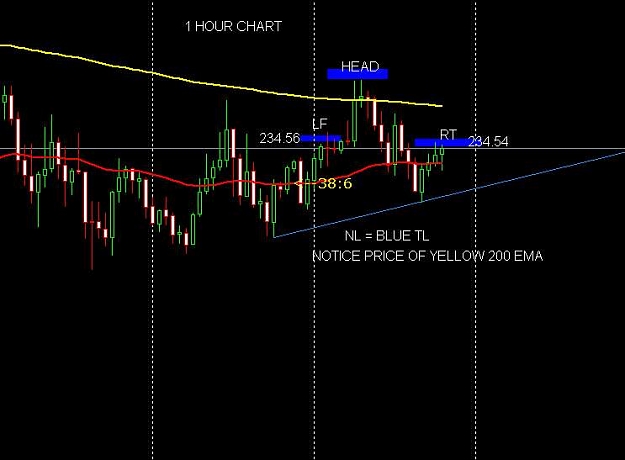
A little info for the chart analyst in training.....
Attached Image (click to enlarge)
Click to Enlarge

Name: 10-27 1 HR.jpg
Size: 32 KB
 
 
  • Post #226
  • Quote
  • Oct 27, 2007 7:27am Oct 27, 2007 7:27am
  •  PipChick
  • | Membership Revoked | Joined Sep 2007 | 4,407 Posts
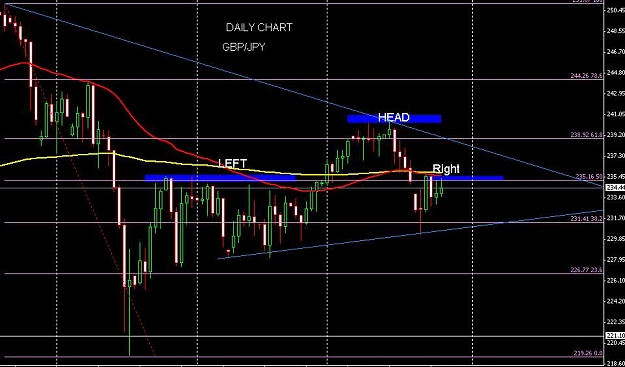
Daily Chart.
Put the 1 hr and daily side by side and evaluate.
If we buy this week we want to have tight stops.
Attached Image (click to enlarge)
Click to Enlarge

Name: 10-27 DAILY.jpg
Size: 35 KB
 
 
  • Post #227
  • Quote
  • Oct 27, 2007 7:28am Oct 27, 2007 7:28am
  •  PipChick
  • | Membership Revoked | Joined Sep 2007 | 4,407 Posts
Quoting emm
Disliked
Thanks for all the help. Had a great day both long and short. Have a nice weekend.
Ignored
Glad you made pips emm
 
 
  • Post #228
  • Quote
  • Oct 27, 2007 9:29am Oct 27, 2007 9:29am
  •  iandekoker
  • | Joined Apr 2007 | Status: Member | 515 Posts
here is what i see as an inverse head and shoulder pattern on daily gbp/usd

Plus look at the nice channel in which we are currently trading
Attached Image (click to enlarge)
Click to Enlarge

Name: gbp.gif
Size: 17 KB
 
 
  • Post #229
  • Quote
  • Oct 27, 2007 10:18am Oct 27, 2007 10:18am
  •  PipChick
  • | Membership Revoked | Joined Sep 2007 | 4,407 Posts
Quoting iandekoker
Disliked
here is what i see as an inverse head and shoulder pattern on daily gbp/usd

Plus look at the nice channel in which we are currently trading
Ignored
Looks like good opportunities for the g/u!
 
 
  • Post #230
  • Quote
  • Edited at 11:10am Oct 27, 2007 10:20am | Edited at 11:10am
  •  PipChick
  • | Membership Revoked | Joined Sep 2007 | 4,407 Posts
Chart Analyst in training note:::
On an inverse h/s, the rt shoulder should be equal to or higher than the left shoulder.

EDIT: The opposite applies for a downward h/s
 
 
  • Post #231
  • Quote
  • Oct 27, 2007 10:27am Oct 27, 2007 10:27am
  •  PipChick
  • | Membership Revoked | Joined Sep 2007 | 4,407 Posts
Very nice post ian..this is what I see for the inverse. The number to the right is how many minutes till next candle open, not the price. Sorry for any confusion. I will remove that from my chart.
Attached Image (click to enlarge)
Click to Enlarge

Name: gbpusd.jpg
Size: 39 KB
 
 
  • Post #232
  • Quote
  • Oct 27, 2007 1:07pm Oct 27, 2007 1:07pm
  •  iandekoker
  • | Joined Apr 2007 | Status: Member | 515 Posts
Quoting PipChick
Disliked
Looks like good opportunities for the g/u!
Ignored
thx yes i agree
 
 
  • Post #233
  • Quote
  • Oct 27, 2007 1:11pm Oct 27, 2007 1:11pm
  •  iandekoker
  • | Joined Apr 2007 | Status: Member | 515 Posts
Quoting PipChick
Disliked
Chart Analyst in training note:::
On an inverse h/s, the rt shoulder should be equal to or higher than the left shoulder.

EDIT: The opposite applies for a downward h/s
Ignored
yes according to the handbook it should be...
 
 
  • Post #234
  • Quote
  • Oct 28, 2007 3:32pm Oct 28, 2007 3:32pm
  •  PipChick
  • | Membership Revoked | Joined Sep 2007 | 4,407 Posts
Daily Chart

Daily chart hasnt changed much. The H/S is still intact and the price is under the 200 ema and aslo just below the 50% fib.
Longs appear risky.
Attached Image (click to enlarge)
Click to Enlarge

Name: Daily 10-28.jpg
Size: 63 KB
 
 
  • Post #235
  • Quote
  • Oct 28, 2007 3:39pm Oct 28, 2007 3:39pm
  •  PipChick
  • | Membership Revoked | Joined Sep 2007 | 4,407 Posts
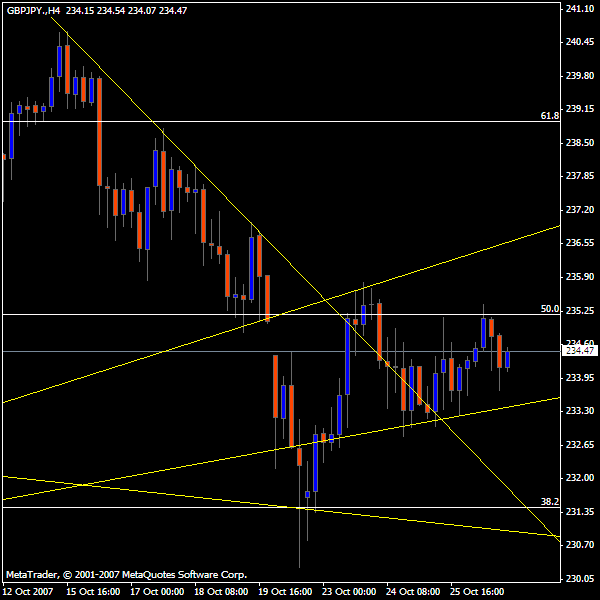
Price remains under the 50 and 200 ema. Scrolling back on your 4 hr chart you will notice that the 200 ema is a very important moving average. We have rate decision coming out this week so expect risk and choppiness.

I would tend to sell (more so than to buy) around the 50% daily fib area. Seems like longs could be risky until after the rate decision or until the pair opens above the 200 ema on the Daily chart.

I dont usually trade the Asian session on Sundays so I will be sitting aside until I see the possible sell opportunity.
 
 
  • Post #236
  • Quote
  • Oct 28, 2007 3:40pm Oct 28, 2007 3:40pm
  •  PipChick
  • | Membership Revoked | Joined Sep 2007 | 4,407 Posts
Here it is...
Attached Image (click to enlarge)
Click to Enlarge

Name: 4 hr 10-28.jpg
Size: 49 KB
 
 
  • Post #237
  • Quote
  • Oct 28, 2007 3:43pm Oct 28, 2007 3:43pm
  •  PipChick
  • | Membership Revoked | Joined Sep 2007 | 4,407 Posts
Can someone post the 1 hr H/S pattern chart? TY
 
 
  • Post #238
  • Quote
  • Oct 28, 2007 4:55pm Oct 28, 2007 4:55pm
  •  DollaBill
  • | Joined Jan 2007 | Status: Member | 246 Posts
Quoting PipChick
Disliked
Can someone post the 1 hr H/S pattern chart? TY
Ignored
Here ya go
Attached Image (click to enlarge)
Click to Enlarge

Name: gbpjpy.gif
Size: 30 KB
 
 
  • Post #239
  • Quote
  • Oct 28, 2007 5:00pm Oct 28, 2007 5:00pm
  •  PipChick
  • | Membership Revoked | Joined Sep 2007 | 4,407 Posts
Quoting DollaBill
Disliked
Here ya go
Ignored
TY DollaBill
 
 
  • Post #240
  • Quote
  • Oct 28, 2007 5:14pm Oct 28, 2007 5:14pm
  •  PipChick
  • | Membership Revoked | Joined Sep 2007 | 4,407 Posts
Daily: H/S, trading just under 50% fib, trading beneath 200 ema.
4 HR: Trading just beneath 200 and 50 ema
1 HR: H/S, trading just beneath the 200 ema and with in a consolidation. (green lines)

Probibility would lean towards the short side. But also be prepared for a breach of the 200 emas. Always have a short plan and a long plan and lean more towards the probility side.
Attached Image (click to enlarge)
Click to Enlarge

Name: 1 hr 10-28.jpg
Size: 31 KB
 
 
  • Trading Discussion
  • /
  • CHART Reading for serious traders
  • Reply to Thread
    • 1 1011Page 121314 23
    • 1 11Page 1213 23
0 traders viewing now
  • More
Top of Page
Forex Factory Blog Updated: Alerting All Members
  • Facebook
  • Twitter
About FF
  • Mission
  • Products
  • User Guide
  • Media Kit
  • Blog
  • Contact
FF Products
  • Forums
  • Trades
  • Calendar
  • News
  • Market
  • Brokers
  • Trade Explorer
FF Website
  • Homepage
  • Search
  • Members
  • Report a Bug
Follow FF
  • Facebook
  • Twitter

FF Sister Sites:

  • Metals Mine
  • Energy EXCH
  • Crypto Craft

Forex Factory® is a brand of Fair Economy, Inc.

Terms of Service / ©2022