Hi Imransait, I want to thank you once again cuz ever seen I follow your 5MIN system so far I am very successful in my trade, can you include me in your skype list my email [email protected]
Imran, (and other veteran traders on this thread) when taking a position with this system I sometimes get confused when price is above/below/between the EMA 60, EMA 200, middle Bollinger, or Daily Pivot or some combination there of.
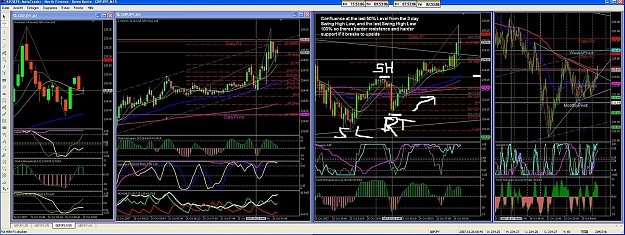
I was wondering if you could tell us which of these indicators you would prioritize over the others... I’m guessing the Daily Pivot is the strongest of these. So that we always want to go Long above the Daily Pivot and short when price action is below this pivot. The picture on the first post just adds to my confusion as:
1. The first position (starting at the red vertical far left) shows price position below the DailyPivot and above the EMA 60/200 and is a long right into the Daily Pivot.
2. The second position shows price position above the DailyPivot, EMA60/200 and is shorting right into all 3 of them. (The Lags look great... But this seems like a nightmare trade to me )
3. The Third position seems like the most ideal to me, as price position is below the DailyPivot, EMA 60/200, and I would probably place a 4 to 5% risk on this short.
As always, thank you all so much for your generosity and taking the time to teach all of us newbie’s this great system of trading...
4xMike...
guys
below is a 1hr chart..if u look at the last 3-4 candles..all are pointing towards a down, i would be careful unless it goes below the daily pivot, i would be on the sidelines and will take a short after a close of a 15min candle below 234 and the setup of lags at that time..there is resistance at 235.09 from the 200 EMA on the 1hr..looks to be a nice place to go short for 150-200 pips fall
if price does not go higher then 234.65 in the next 1 hr..i would be tempted to take a short for a scalp with a tight SL at 234.80 , lets see
a test of 233.00 area is on the cards if 234.00 area falls
Imran, (and other veteran traders on this thread) when taking a position with this system I sometimes get confused when price is above/below/between the EMA 60, EMA 200, middle Bollinger, or Daily Pivot or some combination there of.
I was wondering if you could tell us which of these indicators you would prioritize over the others... I’m guessing the Daily Pivot is the strongest of these. So that we always want to go Long above the Daily Pivot and short when price action is below this pivot. The picture on the first post just adds to my confusion as:
1. The first position (starting at the red vertical far left) shows price position below the DailyPivot and above the EMA 60/200 and is a long right into the Daily Pivot.
2. The second position shows price position above the DailyPivot, EMA60/200 and is shorting right into all 3 of them. (The Lags look great... But this seems like a nightmare trade to me )
3. The Third position seems like the most ideal to me, as price position is below the DailyPivot, EMA 60/200, and I would probably place a 4 to 5% risk on this short.
As always, thank you all so much for your generosity and taking the time to teach all of us newbie’s this great system of trading...
4xMike...
Ignored
mike, will try to answer ur queries,
1. See the climb of the 60ema on the first position, classical case of long trade and the stoch also agreeing with it, target would be Daily Pivot and moving Tp as it approaches and watching the candle action at that point.
2. the lags dont lie if even stoch is agreeing, so it was a safe trade with a tight SL, infact when all 3 are in agreement the movement is more profitable and u can wait till the red lag comes complete down and then moves up.
3. Also a good position, but not the best one, also notice that u can take a trade even when the blue lag is close to 0.45 area and coming down, still give u enough place to book profits as red lag was down and flat
i would place a 5% risk on trade 2 , not on trade 3
my risk levels would be 2% for trade 1, 5% for trade 2 and 2% for trade 3
WOW, no posts and a slow night so far. GJ has been in a tight range last hour and half. Last forty five minutes it has been squeezed by middle bol and 60ma. Of course it was lunch time in Japan:. Seems to be consolidating? Maybe for a move down. Looking at a 5m chart.
WOW, no posts and a slow night so far. GJ has been in a tight range last hour and half. Last forty five minutes it has been squeezed by middle bol and 60ma. Of course it was lunch time in Japan:. Seems to be consolidating? Maybe for a move down. Looking at a 5m chart.
Ignored
a really very slow move today...price is consolidated and now the moves will happen as asia starts to close, frankfurt opens and then London Opens, we could see movement then.till then am off for a nap..see u all in 1hr time
have a small short open at 234.45 tp is 233.70 SL is 234.75 , so lets see what happens
Imran,
I think I finally get it... the Lag1 and Lag2 plus the StochHist determine the power of the potential trade!!! All three is a very powerful tade! While just Lag1 and StochHist are the average trade... Then we use the pivots, and EMAs to determine profit areas.... I thought I had read somewhere in the threads that we should only go long above the DailyPivot, and short when price position is below it? Is this correct or should we just go with the power of Lags 1 and 2 and the StochHist? Thanx Imran, really appreciate the clarity...
4xMike...
wales, they are part of the method, not the main method, lags play a very important role
Ignored
Imran, I understand the Fibo and Pivot Point are part of the method but does not play major roles. If my Lags are confirming a down trend at just exactly a price close to the top of the Pivot, should the trade be entered?
As for EMA's, if the price action is above the EMA's is it good to trade or not trade at all or is it that the best trades to take would be buy or sell?
Still compiling some questions. Many more to come.
Can anyone tell me what went wrong with my trade in the chart below? The first chart was my entry while the other is my exit.
Also, we need strict rules on entry and exits. We have our individual minds which is what triggers our trades but for other newbies and myself, I think great help would be done to us by giving details on entering and exiting trades. Not like spoon feeding us but apart from all normal basics, we need to know more about the EMA's, Bollinger Bands, and other parameters before entering trades.
Like in 1 of the post, Imran said the higher TF should be considered and in another TF he said it is not really compulsory. Let us know reasons for these.
Ignored
You made the right trades but the asian session is a low time of equidity so price moves very little most nights and it moves back and forth alot...it's a hard time to trade than
This is were this system lacks a little it dares you to trade against the trend..when you should be looking for pullbacks and trade with the trend..if your new..please don't trade against a trend...and watch for a trade that lines back up with the trend
I'll take a look at your response in a couple of hours. I have to grab some sleeep real quick and be back. That is provided to get a chance to respond. Bye!
Ignored
Ann and PipHunter, all you need to do to your LAG setting is to choose Fiexed Minimum and Maximum and they will be alright. Fixed Minimum should be set at -0.05 and Fixed Maximum at 1.05.
|
Joined Oct 2007
|
Status: The pip sniper
|110 Posts
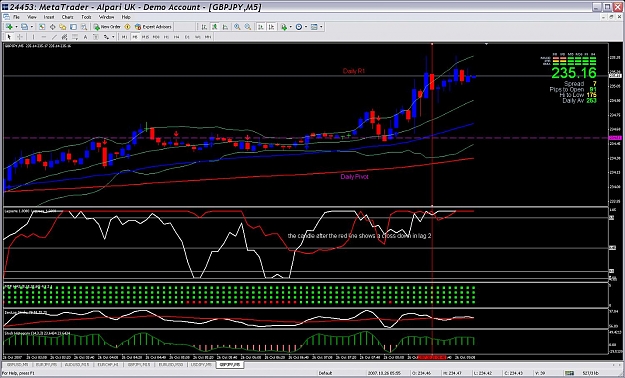
Hi fellow chart watchers, did any of you watching th gbpjpy have a brief period when lag 2 crossed down below the .90 level with lag 1 continuing to point towards upward momentum?
if u have noticed, japenese news cames out, core cpi these take medium impacts and was as expected then the industrial production -1.4% -0.1% more then expected... all around all, it was negative for the yen, so all traders in asian session was bearish for the yen... so i can see, u have the laguerre filter placed in your chart...
bullish(GBP) signs in the chart blue ema above red, both heading up to northeast, the price is moving from the left bottom corner to the right top corner BB base line running flat laguerre filter also running flat, Red Lad on top, did u see, how slow the Stoch Histo came??? So as reaction of the action, u should see, that ur position don't run into profit, and that the signs are for eurosession are tending more bullish, so reversal then if price is above blue and red ema, longs are better....
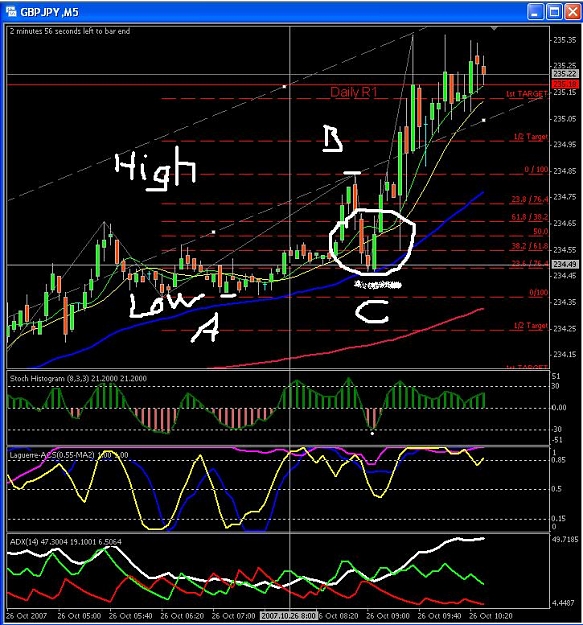
please begin to see the whole picture, there are keypoints, price tumbling around a psychological number the 50, and when u had draw on 15 min chart from the last swing H/L from yesterday to today night you had seen that the price touches the 38.2%
if u have noticed, japenese news cames out, core cpi these take medium impacts and was as expected then the industrial production -1.4% -0.1% more then expected... all around all, it was negative for the yen, so all traders in asian session was bearish for the yen... so i can see, u have the laguerre filter placed in your chart...
bullish(GBP) signs in the chart blue ema above red, both heading up to northeast, the price is moving from the left bottom corner to the right top corner BB base line running flat laguerre filter also running flat, Red Lad on top, did u see, how slow the Stoch Histo came??? So as reaction of the action, u should see, that ur position don't run into profit, and that the signs are for eurosession are tending more bullish, so reversal then if price is above blue and red ema, longs are better....
please begin to see the whole picture, there are keypoints, price tumbling around a psychological number the 50, and when u had draw on 15 min chart from the last swing H/L from yesterday to today night you had seen that the price touches the 38.2%
Ignored
Hi there, not sure if the above was meant to respond to my question, if so, i didnt enter a trade in any event stoch histogram was nto in agreement anyway.
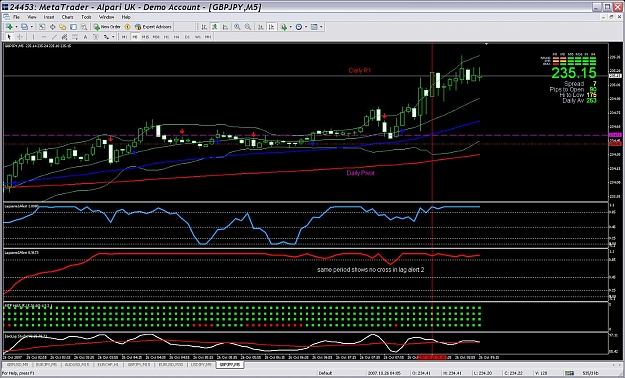
I'm simply trying to get to the bottom of whether or not one of my Lags is incorrect as there was no cross down on the chart i have running the lag alert 1 but there was on the one not runnung it
Hi there, not sure if the above was meant to respond to my question, if so, i didnt enter a trade in any event stoch histogram was nto in agreement anyway.
I'm simply trying to get to the bottom of whether or not one of my Lags is incorrect as there was no cross down on the chart i have running the lag alert 1 but there was on the one not runnung it
|
Joined Oct 2007
|
Status: The pip sniper
|110 Posts
Cheers Iqtrading, just wasnt sure. To illustrate my point and concern please seethe chats below and notice one shows a cross down and the other does not
Cheers Iqtrading, just wasnt sure. To illustrate my point and concern please seethe chats below and notice one shows a cross down and the other does not
Ignored
Maybe with your settings is something wrong??? could be. because the laguerre alert should have the same preferences and the same code like the normal laguerre... on my i take everytime before london open a high and low from the current seesion and draw a little fib in it, so when the price hits retraces to a significant turning point like 50,61.8,76.4 then i watch out what indicators do...
Cheers Iqtrading, just wasnt sure. To illustrate my point and concern please seethe chats below and notice one shows a cross down and the other does not
Ignored
Rocwell,
merely overlaying the Lag's in a single window produces different results, is that what you're saying? - that's no good, even a bit disconcerting...
Have to test this myself.