What do you think about the question I posed at post #3350? You've been doing pretty well with this system right? So I was wondering if you use that type of entry much?
Ignored
Sorry for my delay--JUST SAW your question posed to me, lemme look at it and I'll post my answer on this forum..go catch some Zzzzzs!
When Imran speaks of short term, you need to include the support and resistance areas etc.and not to rely soley on the lags.
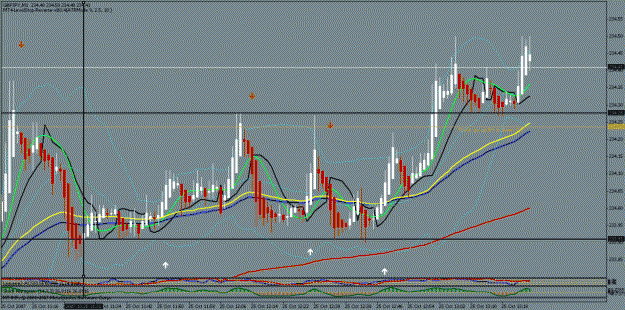
I have outlined the 1min chart where you can clearly see how price tested the 233.91 area several times during this range. Finally price broke through the top channel, Daily pivot.
I was wondering if you trade often one of the setups shown on post 1 by BFried? On the second chart, trades 1 & 3.The setup is where both Lags are say flat at the top. Lag1 dives south beyond the .45, sometimes all the way to the other side mark and enter on the return back across the .45 (which is where you enter) to rejoin the Lag2 which is still flat at the top?
Sometimes it just seems hard to be sure price isn’t going to fake you out by continuing through the BB20ma after it does a bit of mild consolidating around that area. You would obviously have to try and make sure price is committed to going in one of the directions which means giving up some pips. I’ve been burned a few times because of not being patient enough. And I was wondering how other traders were doing with this setup.
If price is moving swiftly one direction, I assume you can drop down to the 1m to gain an entry sooner than waiting for one on the 5m?
Ignored
Piphunter, Not sure if this is what you're looking for, but, let's say LAG 2 is FLAT on TOP or FLAT on BOTTOM...I will, IF THE STOCH AGREES, take the trade signal trigger of LAG 1IF it is going in the same direction heading to where LAG 2 is lying flat...Is this what you were looking for? (That's provided I didn't get in on the trade earlier...)
Also an important note (unrelated) is that IF THE PAIR IS CHOPPING (CONSOLIDATING/TIGHT RANGE) I put the LAGS on the back burner and watch UNTIL A BREAKOUT HAS HAPPENED AND SHOWN ME WHICH DIRECTION THE PAIR IS GOING. My 2 cents...
Hi Guys
From Nov 1st, i will open a skype chat room where there will be 24hr live trading by some experienced traders and myself, i would like those who are in Asian Zone, London Zone and US Zone to pm me
I will post the chat link here if its ok by the Admin or send by email to all
Ignored
Hi Imran
Mate I can't PM you, can you email the link? My email is [email protected] thanks
Ur charts like truly clear, i like this way, 1 question, which levels u have added to your slow MA... i had seen yesterday and forgot to ask... maybe u can explain a little bit how u read ur setups... thx a lot
I hope you made a lot of pips since yesterday
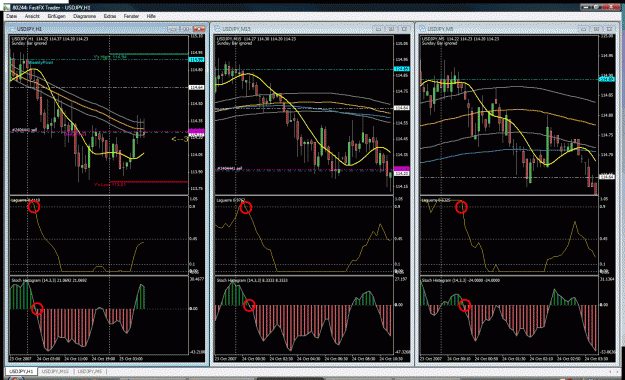
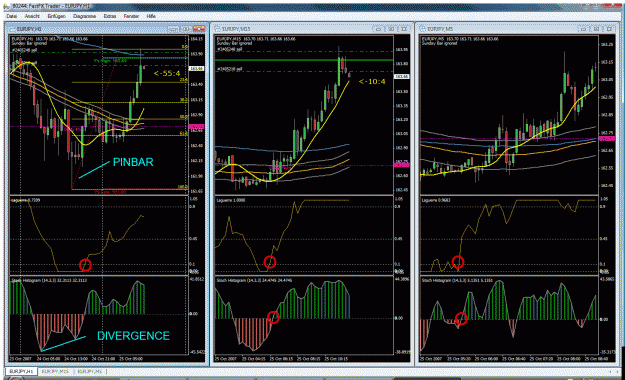
I've attached a snapshot of the USD/JPY pair watching three
timeframes => 1h, 15min, 5min chart.
You clearly can see that if all three lags are matching together, we have
a nice move .....
This requires a lot of patience and discipline !!
But the reward pays more than twice your effort...
By the way concentrate on ONE pair only and trade by using the
multitimeframe approach !!
Greetings and happy pippin
Bernhard
Ignored
Hi Bernhard
Thanks for your post, its important for newbies to first concentrate on one pair so they can learn about its movements, its support/resistance etc, and sticking to simple system always works, no need to clutter screen with tons of indicators.
You have done a nice work of the variation of the Lag and stoch, setup seems to be really good and sticking to rules will make it more easier to trade,rather then just doing trade for the sake of doing so
keep up the good work and keep posting ur charts so all of us can learn
I was wondering if you trade often one of the setups shown on post 1 by BFried? On the second chart, trades 1 & 3.The setup is where both Lags are say flat at the top. Lag1 dives south beyond the .45, sometimes all the way to the other side mark and enter on the return back across the .45 (which is where you enter) to rejoin the Lag2 which is still flat at the top?
Sometimes it just seems hard to be sure price isn’t going to fake you out by continuing through the BB20ma after it does a bit of mild consolidating around that area. You would obviously have to try and make sure price is committed to going in one of the directions which means giving up some pips. I’ve been burned a few times because of not being patient enough. And I was wondering how other traders were doing with this setup.
If price is moving swiftly one direction, I assume you can drop down to the 1m to gain an entry sooner than waiting for one on the 5m?
Ignored
To this note, I would like to say that i find this particular setup very risky from what I have experienced myself. It is much better (my opinion) to take the more conservative setups where both lags are in agreement or are about to go to agreement (ie both flat on top or bottom and blue changing direction first with red about to follow).
I have been trading the system for 3 weeks (real account) with great results, while only trying to take the most conservative of entries.
Of course keep in mind that this is my experience and may also depend on the pair traded and its particular behaviour in the selected tiemframe.
Ur charts like truly clear, i like this way, 1 question, which levels u have added to your slow MA... i had seen yesterday and forgot to ask... maybe u can explain a little bit how u read ur setups... thx a lot
Ignored
Judging from what I see on his charts he is using the Lag filter and the envelope ocillator
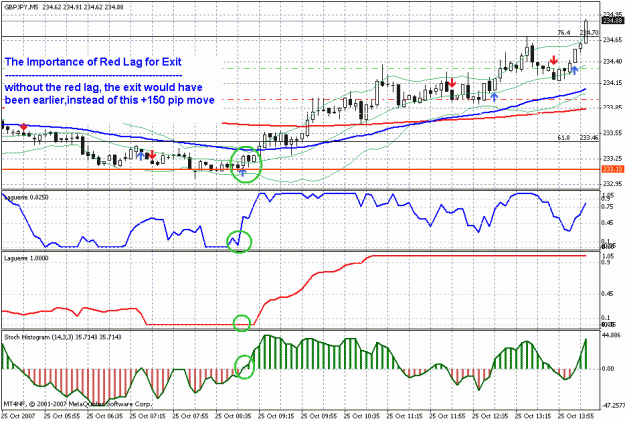
See below example for proof that the red lag helps in almost doubling the pips if we stick to basic rules , the stoch is a bonus if it agrees with the lags
also note price has always been in the upper portion of the bollinger band, this is another confirmation of the long trade
and price was above daily pivot...all these factors made this a good trade
This is my 1st post in this thread and I must say this method is simply fantastic. I have been following the thread in its early development and hopefully I will continue to learn a few things to improve my trading. I am using demo a/c for now and I feel that I need to be more consistent before I open a real a/c. Many thanks in advance to imransait and the rest for sharing their opinions. I will continue to post my charts from time to time as I can only trade from 11am to 4pm (GMT).
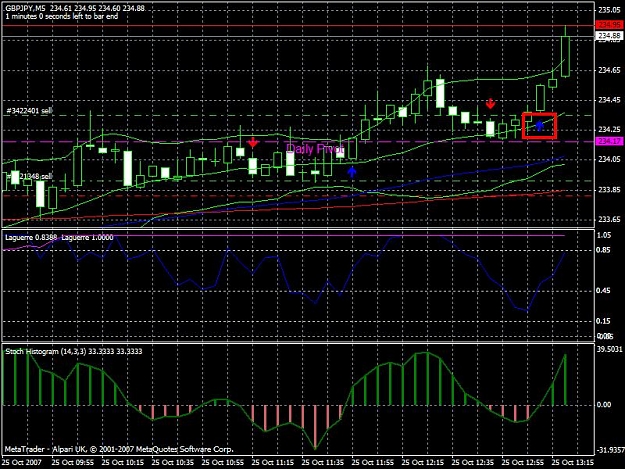
Below is my 1st chart and I went long as according to Ann's previous post. Red Lag was pinned on the top, Blue Lag has gone up past 0.45 and Stoch went from -ve to +ve. Managed to get 50 green pips.
See below example for proof that the red lag helps in almost doubling the pips if we stick to basic rules , the stoch is a bonus if it agrees with the lags
also note price has always been in the upper portion of the bollinger band, this is another confirmation of the long trade
and price was above daily pivot...all these factors made this a good trade
Ignored
I thought I was just gonna maybe scalp some--but turned out much better! When the right signal is given, the lags are so darn accurate!
This is my 1st post in this thread and I must say this method is simply fantastic. I have been following the thread in its early development and hopefully I will continue to learn a few things to improve my trading. I am using demo a/c for now and I feel that I need to be more consistent before I open a real a/c. Many thanks in advance to imransait and the rest for sharing their opinions. I will continue to post my charts from time to time as I can only trade from 11am to 4pm (GMT).
Below is my 1st chart and I went long as according to Ann's previous post. Red Lag was pinned on the top, Blue Lag has gone up past 0.45 and Stoch went from -ve to +ve. Managed to get 50 green pips.
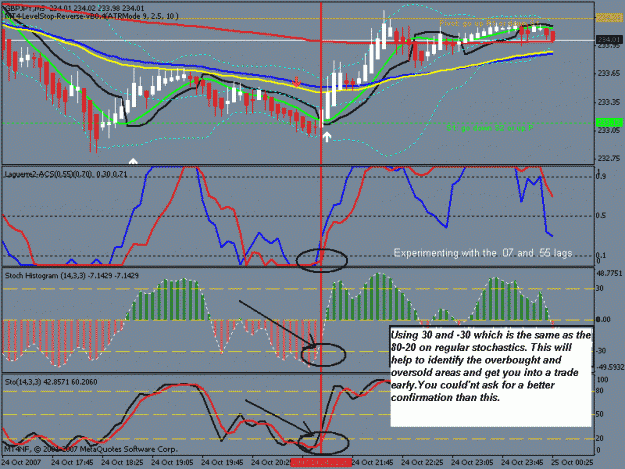
This is an added feature that I included on my stoch histogram. I basically overlayed ( drop and drag )the regular stoch indicator over the top of the histogram to determine the correct levels. Stoch uses 80,20, the histogram used is 30,-30 and matches up nicely. Using ob/os can help you get into trades a candle or two early.
In reference to your chart Imran I am experimenting with using the .70 (red)
and the .55 (blue) When the red lag is pinned against the top you can use the blue lag to scalp when the price retraces on an up or down trend in conjunction using the ob/os histogram.
In reference to my chart you can see that the trend is up red lag pinned at top and blue lag retraces down to the 50 and exit when it crosses back over.
Ignored
you are damn good man...ur one of the guys i want on the skype chat to help and give anaylsis..hope ur free to do that apart from ur trading
Hi all...I decided to post so that I could be a part of the skype program..I have been reading and learning for 2 weeks now and have done the best ever in my trading....I admitt I have alot more to learn...Thanx for the great system and all the knowledge..
Karen
This is an added feature that I included on my stoch histogram. I basically overlayed ( drop and drag )the regular stoch indicator over the top of the histogram to determine the correct levels. Stoch uses 80,20, the histogram used is 30,-30 and matches up nicely. Using ob/os can help you get into trades a candle or two early.
In reference to your chart Imran I am experimenting with using the .70 (red)
and the .55 (blue) When the red lag is pinned against the top you can use the blue lag to scalp when the price retraces on an up or down trend in conjunction using the ob/os histogram.
In reference to my chart you can see that the trend is up red lag pinned at top and blue lag retraces down to the 50 and exit when it crosses back over.
Ignored
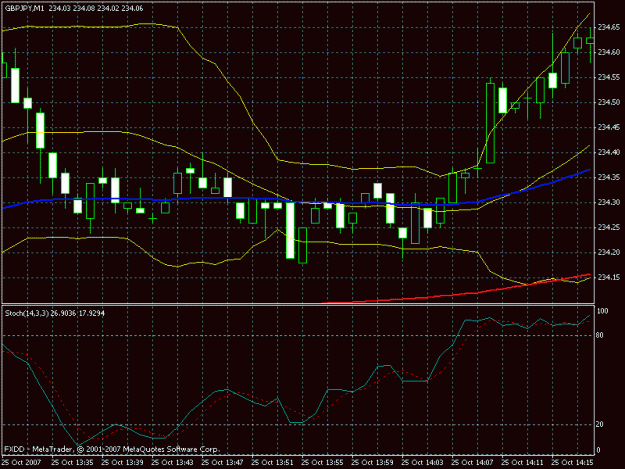
Appears the 14, 3, 3 Stoch might work well on the 1-minute timeframe--seems very responsive...