DislikedI have no clue about TradeStation. But by seeing the code, I think it should produce some error for the following mistakes.
1. Using "Cd = 0;". In MT4 variables are case sensitive. I assume the same for TS also. May be this must be changed to "CD = 0;".
2. The first Plot command misses the ")" before the ";" (compare with other Plot statements.
3. The first place where "L0 = " comes, the last one is LO, not L0 (see the zero and capital o difference). the O should be corrected to zero.
You can try these corrections and see if it helps.
chandra
Addition: I typed my post at the same time as Ohka it looks. I hope the mistake 1 above also have to be checked.Ignored
Hi Sandra, I have the instructions and the fixes but i still could not get it to work. Could you please look at it and possibly fix the code for me.....
thanks
{ Helpful instructions on the use of EasyLanguage, such as this, appear below and are
contained within French curly braces {}. There is no need to erase these instructions
when using EasyLanguage in order for it to function properly, because this text will
be ignored. }
{ OverBought and OverSold below are INPUTS, or holding places for the values you want
to pass into the indicator. The default values entered below, 80 & 20, can be
replaced with different values at the time the indicator is applied to a chart, which
is the main advantage of using inputs instead of variables. The horizontal
overbought and oversold lines will be drawn at these values. }
inputs: OverBought( 80 ), OverSold( 20 ) ;
{ STEP 1: Replace <FORMULA> with the oscillator formula you wish to plot. Note that
Value1 is a numeric variable, a temporary holding place for the result of your
numeric formula. To assign a non-generic name to your plot, you may replace
"Oscillator" (leaving the quotes) with a name you choose. The specified name will
appear in the chart analysis data window. }
Value1 = <FORMULA> ;
Plot1( Value1, "Oscillator" ) ;
{ Leave the next 2 plot statements as is; these draw the horizontal overbought and
oversold lines. }
Plot2( OverBought, "OverBought" ) ;
Plot3( OverSold, "OverSold" ) ;
{ OPTIONAL STEPS: To specify alert criteria that will sound an audible alert when
triggered, replace FALSE with your criteria. To specify a brief alert description
that will be included in the alert notification pop-up window, insert your
description between the quotes ( "" ). Note that Condition1 is a logical variable, a
temporary holding place for the true-false result of the criteria. }
Value1 = <Condition1 = FALSE ;
if Condition1 then
Alert( "" ) ;
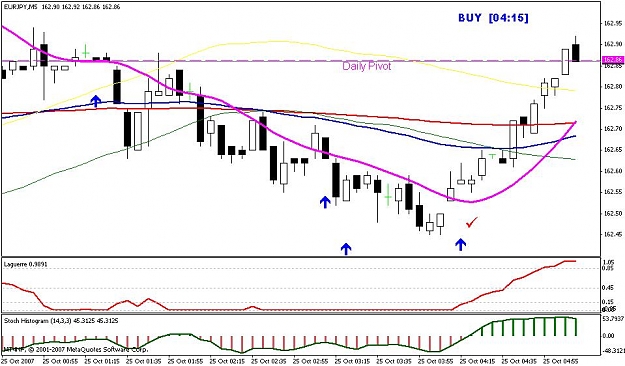
inputs: gamma(0.5) ;
Vars: L0(0) ,
L1(0) ,
L2(0) ,
L3(0) ,
CU(0) ,
CD(0) ,
LaguerreRSI(0) ;
L0 = (1 - gamma) * close + gamma * LO[1] ;
L1 = - gamma * L0 + L0[1] + gamma * L1[1] ;
L2 = - gamma * L1 + L1[1] + gamma * L2[1] ;
L3 = - gamma * L2 + L2[1] + gamma * L3[1] ;
CU = 0 ;
CD = 0 ;
if L0 >= L1 then CU = L0 - L1 Else CD = L1 - LO ;
if L1 >= L2 then CU = CU + L1 - L2 Else CD = CD + L2 - L1 ;
if L2 >= L3 then CU = CU + L2 - L3 Else CD = CD + L3 - L2 ;
if CU + CD <> 0 then LaguerreRSI = CU / (CU + CD) ;
Plot1(LaguerreRSI, "LaguerreRSI") ;
Plot2(.85) ;
Plot3(.15) ;
>