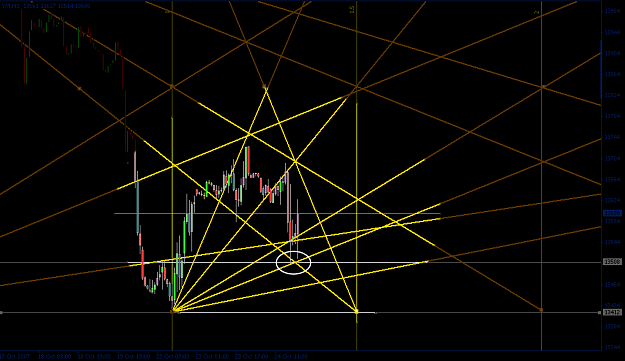
Dislikedthe 30 min chart is showing a formation of HS, to complete it has to go to 230.96, do you think if DOW Closes badly today...will it go there or bounce from the montly pivot of 232.80
thanks
imranIgnored
- #88
- Edited 3:34pm Oct 24, 2007 3:16pm | Edited 3:34pm
- | Joined Nov 2006 | Status: Trader | 5,040 Posts
- #98
- Oct 24, 2007 3:40pm Oct 24, 2007 3:40pm
- Joined Nov 2006 | Status: Dubai | 11,493 Posts
Trade what you see, not what you think.