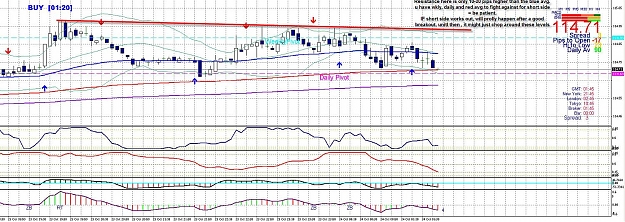
Hi guys. Trying to learn what to look for on 1M and 15M charts when I am trading from 5M TF. On the 5m I see this ideal entry, yes?
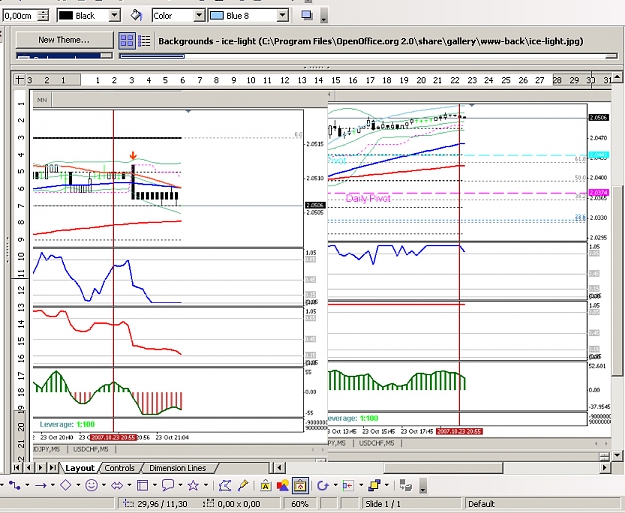
Sorry for the quality of the second graphic, it has the 1M and 15M.
15M: lag1 pointing down, red lag is flat up above, and histogram turning negative.
1M: lag1 is pointing up, lag2 flat and histogram is up.
Does it mean that I should wait till 1M lag1 begins to turn down?
15M is also ready to drop, so is this a sign that the 5M is a good signal? Is this ideal? or not necessarily? Any other observations I need to make on the 1M and 15M? Thanx.
Attached Image(s) (click to enlarge)