Hi Bo,
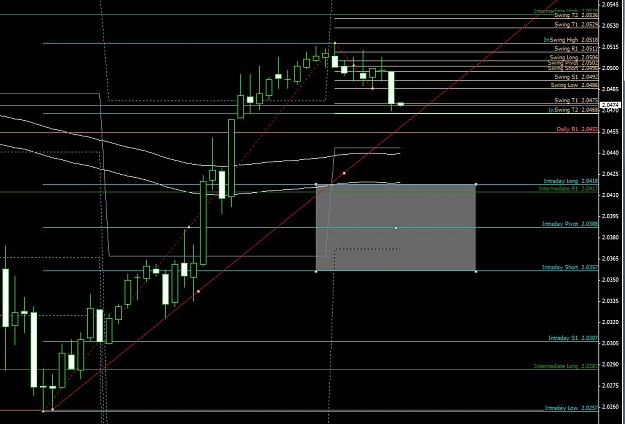
On the attached GBP chart it looks like we have going a 38 fib intraday rejection (green circle). Two candles with wicks that penetrate the 38fib but don't close about that level. Why at that point wouldn't you take a short position? At one point the price would have been well below the swing fib 38 level. Based on the 2 candles in the green circle I thought you would go short there.
On the attached GBP chart it looks like we have going a 38 fib intraday rejection (green circle). Two candles with wicks that penetrate the 38fib but don't close about that level. Why at that point wouldn't you take a short position? At one point the price would have been well below the swing fib 38 level. Based on the 2 candles in the green circle I thought you would go short there.
Attached Image (click to enlarge)